
Home › HR & Workforce Management › Compensation Analysis Template Excel
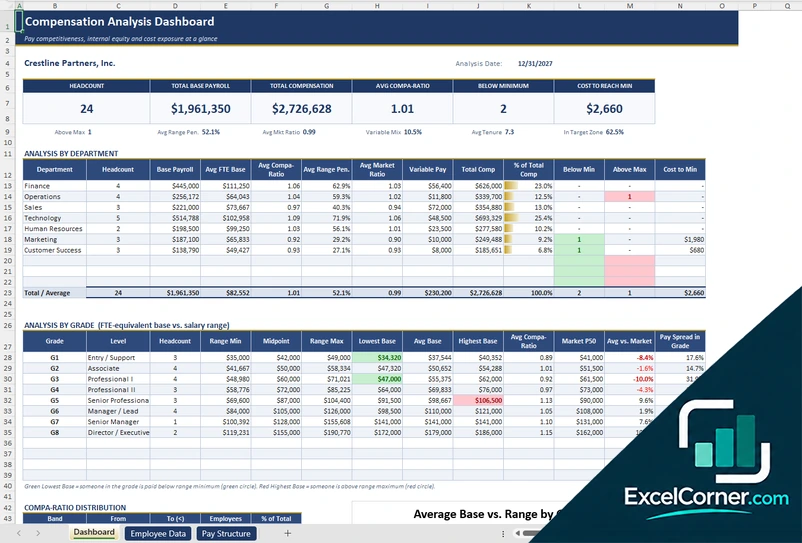
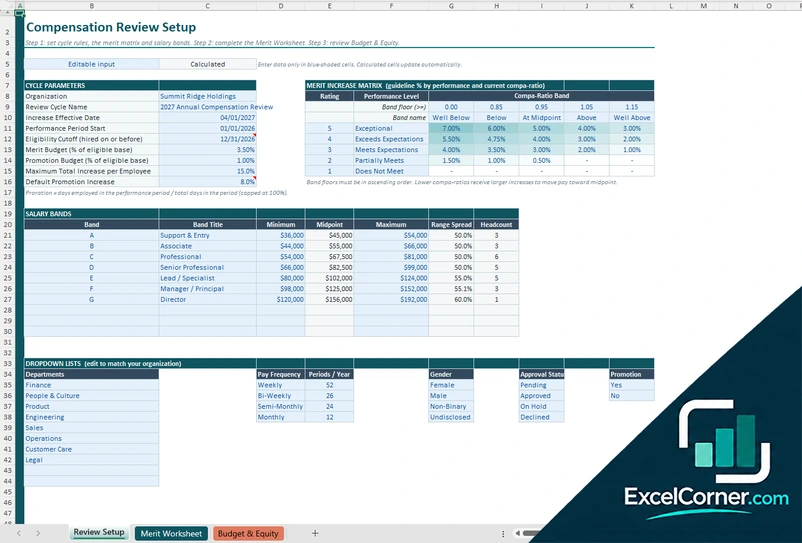
Previewing: Version 1 · Compensation Analysis Dashboard. Pick another version on the right.
Instant download · No sign-up · No email
Use this free compensation analysis template for Excel to see whether your pay is competitive and fair. Compare each employee with salary ranges and the market, spot people paid below range, and plan merit increases within budget. Pick the version that fits your review.
Choose your version
- File
- .xlsx · 60 KB · 3 sheets
- Works with
- Microsoft Excel (.xlsx)
- Macros
- None · formulas only
- Price
- Free
Analyze employee pay and plan reviews in Excel
A compensation analysis compares what you pay with a reference: your own salary ranges, the market and the pay of similar employees. The most common measure is the compa-ratio, an employee’s pay divided by the midpoint of the salary range for their grade. A ratio near 1.00 means pay is at the midpoint.
These Excel compensation analysis templates cover two stages. The first is an analysis of current pay: a dashboard with payroll, total compensation, compa-ratio and range position by department and grade, based on your employee data and your pay structure. The second is a compensation review: a merit matrix, a worksheet for every employee and a budget and equity check before you approve the increases.
Best for
- HR teams that review pay competitiveness and internal equity
- Managers who need to plan merit increases and promotions within a budget
- Small and mid-size companies that build salary grades and ranges
Maybe not for
Companies that need market data from a salary survey. You add the market figures yourself, because the templates do not include live salary data.
Which version is right for you?
Both are free, formula-driven Excel files with sample data you can replace. They are independent, so you can download both.
Version 1
Compensation Analysis Dashboard
Compare pay with salary ranges and the market, and see compa-ratio, range position and cost exposure by department and grade.
DashboardEmployee DataPay Structure
.xlsx · 60 KB
Version 2
Compensation Review Planner
Set a merit matrix and budget, complete a worksheet for every employee and check the spend and equity before approving increases.
Review SetupMerit WorksheetBudget & Equity
.xlsx · 67 KB
What is inside the compensation analysis Excel templates
Version 1: Compensation Analysis Dashboard
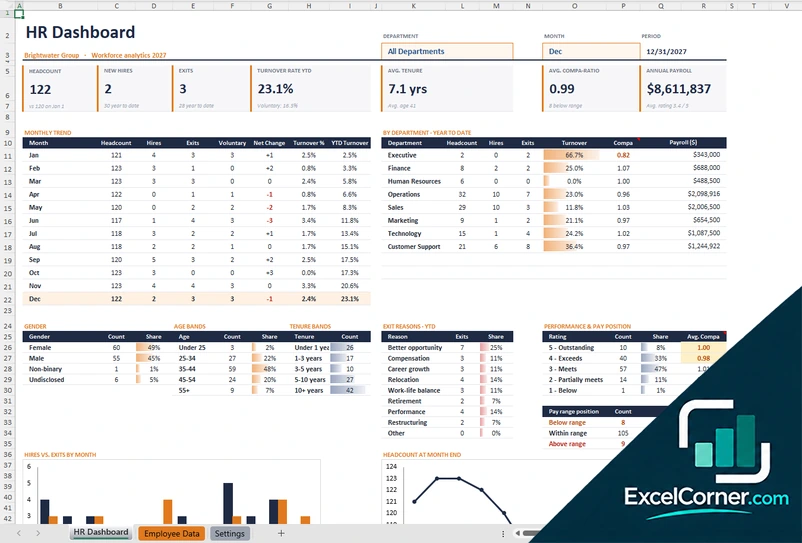
On the Pay Structure sheet you define the salary grades with a level description, a range spread, a minimum, a midpoint and a maximum, together with a market benchmark for each grade, and set the default benefits load and the compa-ratio target zone. On the Employee Data sheet you enter one row per employee, and the compa-ratio, range position and total compensation are calculated. The Dashboard shows the headcount, the total base payroll, the total compensation, the average compa-ratio, the employees below the range minimum and the cost to bring them to it, with the average range penetration, market ratio, variable pay mix and tenure. Tables break the results down by department and by grade, and a compa-ratio distribution shows how many employees fall in each band.
Version 2: Compensation Review Planner
On the Review Setup sheet you enter the cycle parameters, such as the review cycle name, the effective date, the eligibility cutoff, the merit and promotion budgets as a percentage of eligible base pay, the maximum total increase and the default promotion increase. You also define the merit increase matrix, with a guideline percentage for each performance rating and compa-ratio band, and the salary bands. The Merit Worksheet has one row per employee, takes the guideline increase from the matrix and lets you enter an override percentage when a manager recommends a different increase, with proration for the time employed. The Budget and Equity sheet compares merit and promotion spend with the budget by department and shows the total cost of the review, the rating calibration and the equity checks.
How to use the compensation analysis template in Excel
- Download
Pick the version you want and open it in Excel. - Set up your pay structure
Enter the salary grades, ranges and market benchmarks, or the merit matrix and salary bands. Fill in the input cells; formula cells calculate on their own. - Add your employees
Enter one row per employee with the department, grade, pay, and for a review, the performance rating and the dates. - Review the results
Check the compa-ratios, the people outside their range and the cost, or compare merit spend with the budget and review equity.
Run the analysis at least once a year and before each review cycle, with up-to-date market data.
Which compensation analysis template do you need?
| Compensation Analysis Dashboard | Compensation Review Planner | |
|---|---|---|
| Question it answers | How competitive and fair is our pay today? | What increases can we give within budget? |
| You enter | Employee pay, grades, ranges and market data | Merit matrix, bands, ratings and employee data |
| You get | Compa-ratio, range position and cost to reach minimum | Guideline merit, budget versus spend and equity checks |
You can use both: the dashboard to understand your pay, and the review planner to plan changes.
Tips for a reliable compensation analysis
- Compare employees with the right grade, because compa-ratio depends on the range midpoint.
- Use market data that matches the job, the location and the date.
- Look at employees below the range minimum first, since they are a retention and fairness risk.
- Include bonuses and benefits to see total compensation, not just base pay.
- Check increases by department, gender or other groups to find unexplained differences.
- Keep a record of the assumptions you used, so the analysis can be repeated next year.
Frequently asked questions
Is this compensation analysis template for Excel free?
Yes. Both versions are free to download as .xlsx files. You do not need an account or an email address.
Which version should I choose?
Choose the Compensation Analysis Dashboard (Version 1) to analyze current pay against salary grades, ranges and market benchmarks. Choose the Compensation Review Planner (Version 2) to plan merit increases and promotions with a merit matrix and check them against the budget and for equity. They are separate files, so you can use both.
What is a compa-ratio?
The compa-ratio is an employee’s pay divided by the midpoint of their salary range. A ratio of 1.00 means the employee is paid at the midpoint, below 1.00 means below it and above 1.00 means above it.
What is range penetration?
Range penetration shows where an employee’s pay sits between the minimum and the maximum of the range, from 0 percent at the minimum to 100 percent at the maximum.
How does the merit matrix work?
The matrix gives a guideline increase for each performance rating and compa-ratio band. Employees who are lower in the range receive a larger increase so that their pay moves toward the midpoint.
Does the template work in Google Sheets?
The files are made for Microsoft Excel and use standard formulas with no macros. You can upload them to Google Drive and open them with Google Sheets, but some formatting or charts may look different.
Is my employee information stored online?
No. The templates are plain Excel files, so the names and pay data you type stay in your own file on your own computer.
These templates are analysis tools with sample data, not pay, legal or HR advice. Review pay decisions and equity with a qualified professional. Excel is a trademark of Microsoft Corporation; Excel Corner is not affiliated with Microsoft.