
Home › Project Management › Earned Value Management Template Excel
Previewing: Version 1 · EVM Control Workbook. Pick another version on the right.
Instant download · No sign-up · No email
Use this free earned value management template for Excel to know whether a project is on budget and on schedule. Enter the planned value, the earned value and the actual cost, and see the cost and schedule performance indices, the forecast at completion and the trend. Pick the version that fits your reporting.
Choose your version
- File
- .xlsx · 58 KB · 4 sheets
- Works with
- Microsoft Excel (.xlsx)
- Macros
- None · formulas only
- Price
- Free
Track project performance with earned value in Excel
Earned value management compares three numbers: what you planned to have done by now, which is the planned value, what you actually got done, which is the earned value, and what it cost, which is the actual cost. From them you calculate the cost variance, the schedule variance and the performance indices, and forecast the final cost and date.
These Excel earned value management templates cover three ways to report. The first is a control workbook with a baseline, progress by control account and a dashboard. The second is a monthly tracker where you enter the data each month and see the S-curve and the trend. The third is a status report with variance analysis, forecast methods and a view by control account.
Best for
- Project managers who report cost and schedule performance to sponsors
- PMOs that standardize status reporting across projects
- Cost controllers who forecast the estimate at completion
Maybe not for
Contractual EVMS compliance, which has formal requirements. These templates implement the standard calculations for project reporting and planning.
Which version is right for you?
All three are free, formula-driven Excel files with sample data you can replace. They are independent, so you can download more than one.
Version 1
EVM Control Workbook
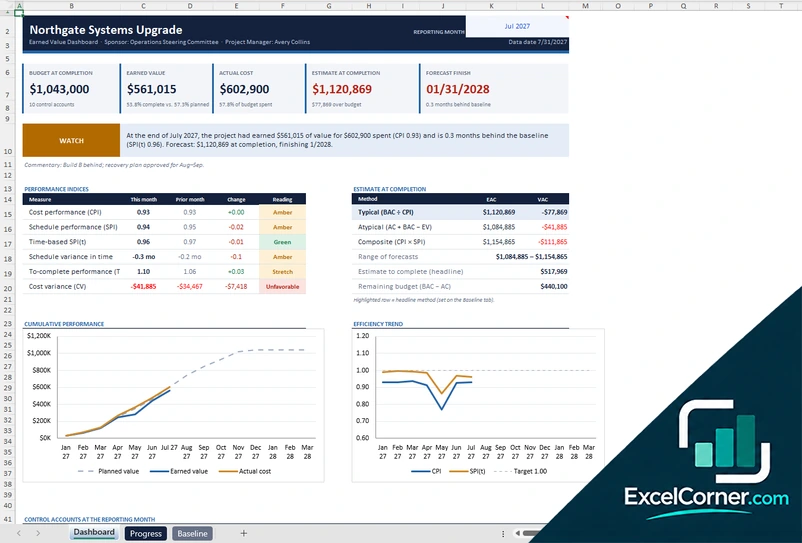
Set a baseline, record progress by control account and see CPI, SPI, forecast and trends on a dashboard.
DashboardProgressBaselineLists
.xlsx · 58 KB
Version 2
EVM Monthly Tracker
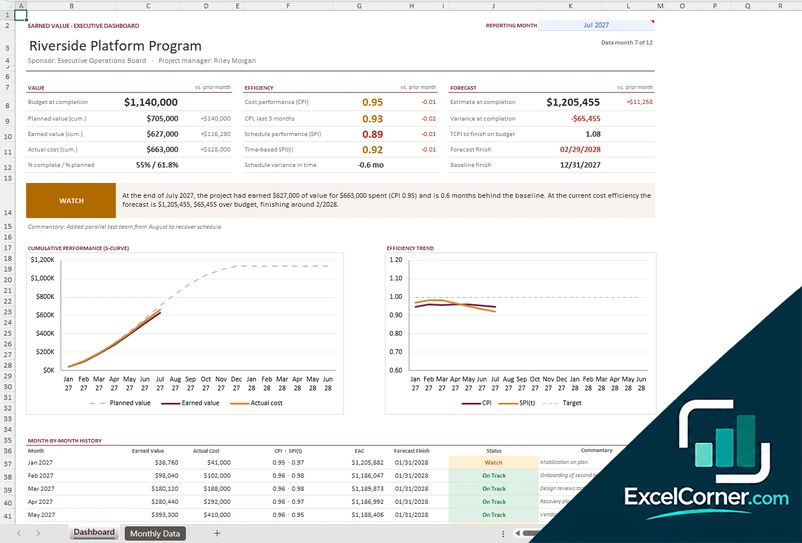
Enter the planned value, the earned value and the actual cost each month and see the S-curve, the indices and the forecast.
DashboardMonthly Data
.xlsx · 32 KB
Version 3
EVM Status Report
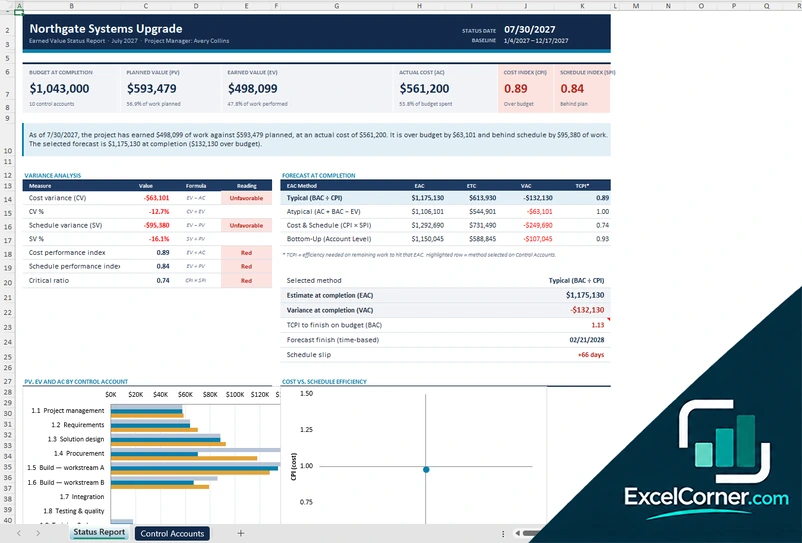
Produce a status report with variances, an estimate at completion by method and a view of planned value, earned value and cost by control account.
Status ReportControl AccountsLists
.xlsx · 35 KB
What is inside the earned value management Excel templates
Version 1: EVM Control Workbook
On the Baseline sheet you enter the project, the sponsor, the budget at completion, the dates and the selected forecast method, and on the Progress sheet you list the control accounts with their budget, planned value and progress for each reporting month. The Lists sheet holds the dropdown values. The Dashboard shows the budget at completion, the earned value, the actual cost, the estimate at completion and the forecast finish, with a status commentary, performance indices such as CPI, SPI, time-based SPI and TCPI with their change from the prior month, an estimate at completion by method, charts of cumulative performance and the efficiency trend and the control accounts at the reporting month.
Version 2: EVM Monthly Tracker
On the Monthly Data sheet you enter the project details, the budget at completion and, for each month, the planned value, the earned value and the actual cost, with a commentary for each month. The Dashboard has a reporting month selector and shows the budget at completion, the cumulative planned value, earned value and actual cost, the percent complete against the percent planned, the cost performance index, the schedule performance index and the time-based index, the estimate at completion, the variance at completion, the TCPI and the forecast and baseline finish dates, with an S-curve, an efficiency trend chart and a month-by-month history with a status.
Version 3: EVM Status Report
On the Control Accounts sheet you enter the planned value, the earned value and the actual cost of each control account, and the Lists sheet holds the values for the dropdowns. The Status Report shows the budget at completion, the planned value, the earned value, the actual cost, the cost index and the schedule index, with a written summary, a variance analysis of the cost variance, the schedule variance, the CPI, the SPI and the critical ratio with a reading for each, and a forecast at completion table with the typical, atypical, cost and schedule and bottom-up methods and the selected one. A chart compares planned value, earned value and actual cost by control account, and a second chart compares cost efficiency with schedule efficiency.
How to use the earned value management template in Excel
- Download
Pick the version you want and open it in Excel. - Set the baseline
Enter the budget at completion, the baseline dates and the control accounts, with their planned value over time. Fill in the input cells; formula cells calculate on their own. - Enter progress and cost
Each month, add the percent complete or the earned value and the actual cost. - Read the indices
Check the CPI, the SPI, the variances and the estimate at completion, and read the forecast finish date.
Update the data at every reporting date and review the forecast methods to choose the one that fits your project.
Which earned value template do you need?
| EVM Control Workbook | EVM Monthly Tracker | EVM Status Report | |
|---|---|---|---|
| Best for | A baseline, progress and control accounts | Monthly data with an S-curve | A status report with forecast methods |
| You enter | Baseline and progress by control account | Monthly planned value, earned value and actual cost | Control account data and the forecast method |
| You get | Dashboard, indices and forecast | S-curve, efficiency trend and monthly history | Variances, EAC by method and a performance chart |
They are separate files, so you can use more than one.
Tips for earned value reporting
- Define a clear baseline and do not change it without a formal change.
- Measure progress with objective rules, such as weighted milestones.
- Report CPI and SPI together with the commentary that explains them.
- Use the forecast method that fits: typical, atypical, cost and schedule, or bottom-up.
- Watch the trend of the indices, not only the latest month.
- Calculate the TCPI to see the efficiency you need to reach the budget.
Frequently asked questions
Is this earned value management template for Excel free?
Yes. All three versions are free to download as .xlsx files. You do not need an account or an email address.
Which version should I choose?
Choose the EVM Control Workbook (Version 1) for a baseline and progress by control account. Choose the EVM Monthly Tracker (Version 2) for a simple monthly entry with an S-curve. Choose the EVM Status Report (Version 3) for a variance analysis and a comparison of forecast methods. They are separate files, so you can use more than one.
What do CPI and SPI mean?
The cost performance index is the earned value divided by the actual cost, and the schedule performance index is the earned value divided by the planned value. A value above 1.0 is better than plan and below 1.0 is worse than plan.
How is the estimate at completion calculated?
The templates show several methods, such as the budget at completion divided by the CPI, the actual cost plus the remaining budget, and the actual cost plus the remaining work divided by a combined CPI and SPI. You choose the method that suits your project.
What is TCPI?
The to-complete performance index is the efficiency you need from now on to finish the project within a target, such as the budget at completion. A value above 1.0 means you need to perform better than so far.
Does the template work in Google Sheets?
The files are made for Microsoft Excel and use standard formulas with no macros. You can upload them to Google Drive and open them with Google Sheets, but some formatting or charts may look different.
Is my data stored online?
No. The templates are plain Excel files, so the information you type stays in your own file on your own computer.
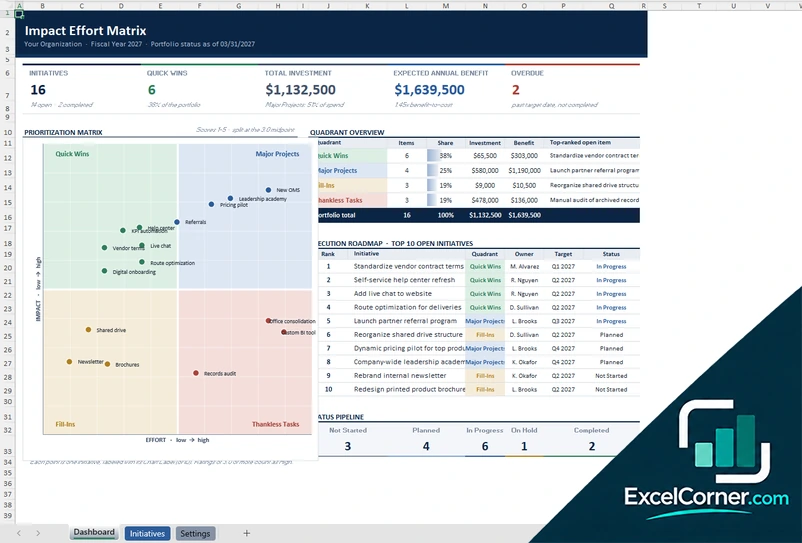
More free project cost and budget templates
These templates are planning tools with sample data. Replace the figures with your own and check the assumptions before you use them for decisions or reporting. Excel is a trademark of Microsoft Corporation; Excel Corner is not affiliated with Microsoft.