
Home › Personal Finance › Bitcoin DCA Tracker Excel Spreadsheet Template
Previewing: Version 1 · Bitcoin DCA Tracker. Pick another version on the right.
Instant download · No sign-up · No email
Use this free Bitcoin DCA tracker Excel spreadsheet to log every purchase, see your average cost and your stack at a glance, and check whether you are sticking to your plan. You can also model a recurring buy plan before you start. Pick the version that fits.
Choose your version
- File
- .xlsx · 150 KB · 2 sheets
- Works with
- Microsoft Excel (.xlsx)
- Macros
- None · formulas only
- Price
- Free
Track your Bitcoin dollar-cost averaging in Excel
Dollar-cost averaging means buying a fixed amount of Bitcoin on a regular schedule instead of trying to time the market. A Bitcoin DCA tracker spreadsheet records each purchase and shows what matters: how much Bitcoin you hold, what it cost you on average and how your stack compares with the current price.
These Excel templates cover three needs. One tracks your purchases and shows holding periods, another measures how consistent you are against your plan and stress-tests your stack, and the third is a planner that models a recurring purchase plan under bear, base and bull price paths. Everything stays in a file on your computer.
Best for
- People who buy Bitcoin on a regular schedule
- Anyone who wants to know their average cost and unrealized profit or loss
- Savers who want to model a plan before they commit
Maybe not for
Anyone who needs tax filing or a full crypto portfolio across many coins. These templates track Bitcoin only and are not tax advice.
Which version is right for you?
All three are free, formula-driven Excel files. They are independent, so you can download more than one.
Version 1
Bitcoin DCA Tracker
Log every purchase and see your holdings, average cost, unrealized profit or loss and progress toward a stack goal.
DashboardTransactions
.xlsx · 150 KB
Version 2
DCA Tracker with Plan
Track your stack and your discipline: bought, missed and current periods, your streak, your pace against the plan and a stress test.
DashboardLedgerSetup
.xlsx · 227 KB
Version 3
Bitcoin DCA Planner
Model a recurring Bitcoin purchase plan across bear, base and bull price paths and see what it could add up to.
PlannerSchedule
.xlsx · 171 KB
What is inside the Bitcoin DCA tracker Excel templates
Version 1: Bitcoin DCA Tracker
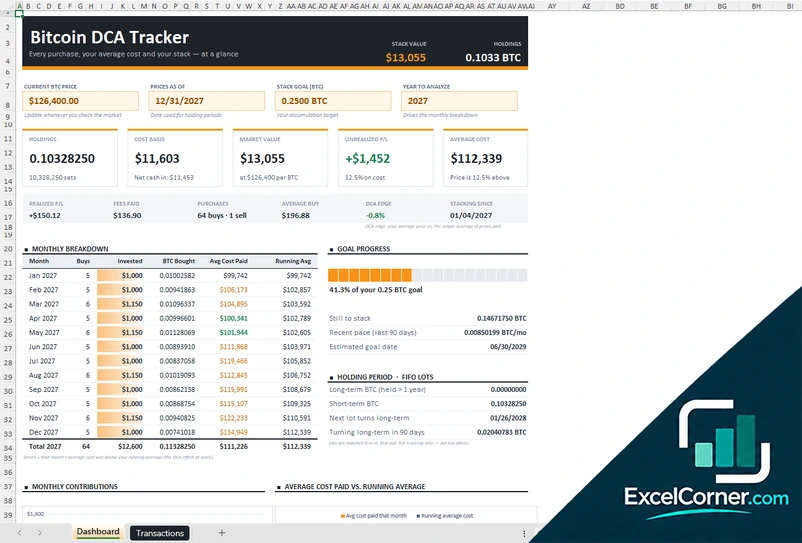
You enter each purchase and sale on the Transactions sheet and the current Bitcoin price and date on the Dashboard. It shows your holdings in Bitcoin and sats, the cost basis, the market value, your unrealized profit or loss and your average cost, plus realized profit or loss, fees paid, the number of buys and sells, your average buy price and a DCA edge that compares your average with the simple average of prices paid. A monthly breakdown lists the amount invested, the Bitcoin bought and the average cost paid, and a goal progress panel shows what is still to stack, your pace over the last 90 days and an estimated goal date. Lots are matched first in, first out to show long-term and short-term Bitcoin, for tracking only.
Version 2: DCA Tracker with Plan
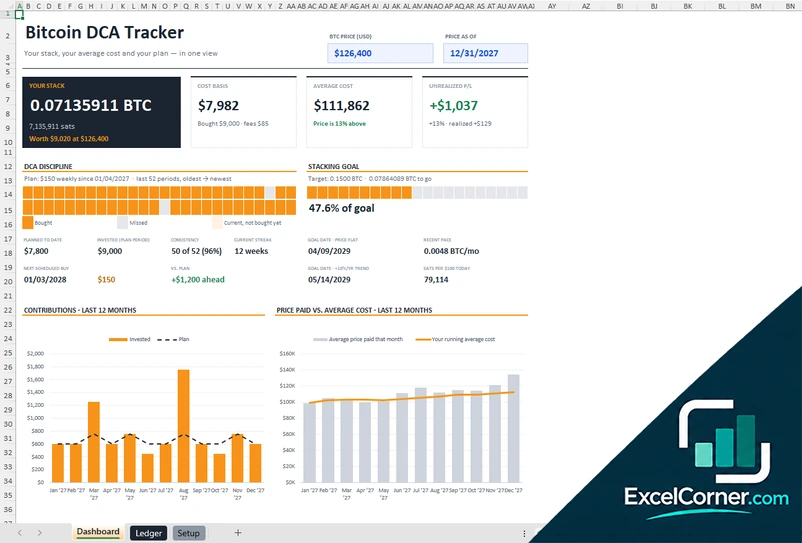
You set your plan on the Setup sheet, with the amount, the period length and your goal, and record purchases in the Ledger. The Dashboard shows your stack in Bitcoin and sats, the cost basis, your average cost and your unrealized profit or loss. A DCA discipline grid marks each period as bought, missed or current, and the dashboard shows the amount planned to date, the amount invested, your consistency, your current streak, your next scheduled buy and whether you are ahead of or behind the plan. Charts compare your contributions with the plan and the price you paid with your running average cost over the last 12 months, and a stress test shows the value of your stack if the price moves by minus 50 percent to plus 100 percent.
Version 3: Bitcoin DCA Planner
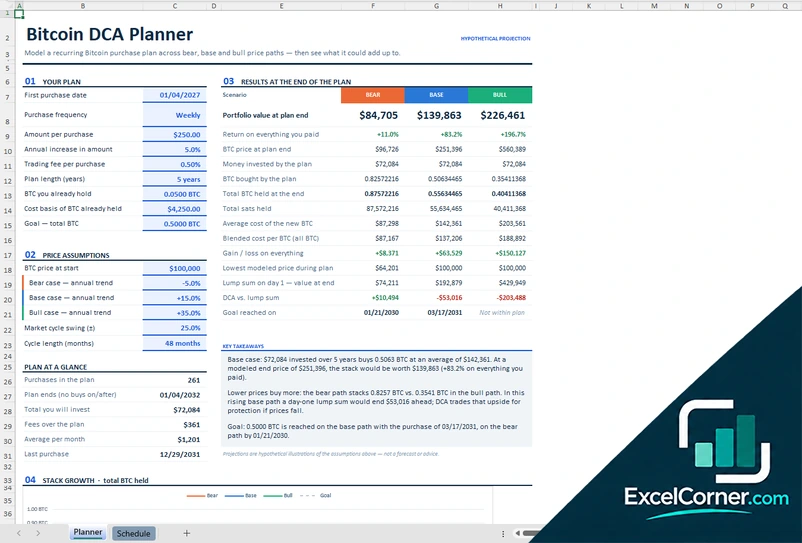
On the Planner sheet you enter the first purchase date, how often you buy, the amount per purchase, an annual increase, the trading fee, the plan length, the Bitcoin you already hold and your goal. You set a starting price and an annual trend for the bear, base and bull cases, plus a market cycle swing and length. The results at the end of the plan show the portfolio value, the return on what you paid, the Bitcoin bought and held, your average cost, the lowest modeled price, how a lump sum on day one would compare with DCA and when you reach your goal, with key takeaways and a stack growth chart. The Schedule sheet lists every purchase. These projections are hypothetical.
How to use the Bitcoin DCA tracker Excel template
- Download
Pick the version you want and open it in Excel. - Log your purchases
Enter the date, the amount in dollars, the fee and the Bitcoin you received for each purchase, and any sales. - Update the price
Type the current Bitcoin price and the date whenever you want to see the value of your stack. - Read the dashboard
Check your holdings, cost basis, average cost and unrealized profit or loss, and how close you are to your goal.
Update the Bitcoin price when you check the market, and log each purchase as soon as it settles so your average cost stays accurate.
Which Bitcoin DCA template do you need?
| Bitcoin DCA Tracker | DCA Tracker with Plan | Bitcoin DCA Planner | |
|---|---|---|---|
| Best for | Tracking purchases, average cost and holding periods | Checking consistency against a weekly plan | Modeling a plan before you start |
| You enter | Each buy or sell and the current price | A ledger and your plan settings | Your plan, price assumptions and holdings |
| You get | Average cost, FIFO lots and goal progress | Streaks, plan vs. actual and a stress test | Bear, base and bull results and DCA vs. a lump sum |
They are separate files, so you can use more than one.
Tips for tracking Bitcoin DCA
- Log every purchase with its fee, because fees change your real average cost.
- Keep your plan simple: a fixed amount on a fixed day, such as weekly or monthly.
- Use the stress test to see what your stack would be worth if the price fell by half.
- Set a stack goal in Bitcoin and watch your pace over the last 90 days.
- Remember that lots held for more than one year may be treated differently for tax; check the rules that apply to you.
- Treat projections as illustrations, because Bitcoin prices are volatile and unpredictable.
Frequently asked questions
Is this Bitcoin DCA tracker Excel spreadsheet free?
Yes. All three versions are free to download as .xlsx files. You do not need an account or an email address.
Which version should I choose?
Choose the Bitcoin DCA Tracker (Version 1) to log purchases and see your average cost, holding periods and goal progress. Choose the DCA Tracker with Plan (Version 2) if you follow a weekly plan and want to see consistency, streaks and a stress test. Choose the Bitcoin DCA Planner (Version 3) to model a recurring purchase plan before you start. They are separate files, so you can use more than one.
What is dollar-cost averaging?
Dollar-cost averaging is buying a fixed amount at regular intervals regardless of the price. You buy more Bitcoin when the price is low and less when it is high, which smooths your average cost over time.
Does it fetch the live Bitcoin price?
No. You type the current price and the date, so the workbook stays a plain Excel file with no links or add-ins.
What does the planner calculate?
The planner models a recurring purchase plan under a bear, a base and a bull price path. It shows the portfolio value, the money invested, the Bitcoin bought, your average cost and how a day-one lump sum would compare. The results are hypothetical illustrations, not a forecast.
Does the template work in Google Sheets?
The files are made for Microsoft Excel and use standard formulas with no macros. You can upload them to Google Drive and open them with Google Sheets, but some formatting or charts may look different.
Is my financial information stored online?
No. The templates are plain Excel files, so the numbers you type stay in your own file on your own computer.
These templates are educational tools, not investment, tax or legal advice. Cryptocurrency prices are volatile, you can lose money, and projections are hypothetical illustrations. Excel is a trademark of Microsoft Corporation; Excel Corner is not affiliated with Microsoft.