
Home › HR & Workforce Management › HR Dashboard Template Excel
Previewing: Version 1 · HR Dashboard. Pick another version on the right.
Instant download · No sign-up · No email
Use this free HR dashboard template for Excel to see headcount, turnover, hiring, pay and engagement on one page. Enter your employee data or your monthly figures and the dashboard calculates the KPIs and charts. Pick the version that fits the data you have.
Choose your version
- File
- .xlsx · 130 KB · 3 sheets
- Works with
- Microsoft Excel (.xlsx)
- Macros
- None · formulas only
- Price
- Free
Build an HR dashboard in Excel from your own data
An HR dashboard turns people data into a few numbers leaders can act on: how many employees you have, how many are joining and leaving, how long they stay, how competitive pay is and how engaged people are. A spreadsheet dashboard needs clean data and clear targets, and then the calculations take care of themselves.
These Excel HR dashboard templates cover three setups. The first is an analytics dashboard built from a list of employees, with headcount, turnover, demographics and pay position. The second is a KPI scorecard fed by monthly figures, with targets and a 12-month status view. The third combines both: an employee-level dashboard with a KPI scorecard measured against your targets.
Best for
- HR managers who report headcount and turnover every month
- Business owners who want a simple view of workforce health
- Teams that need an HR metrics dashboard without buying software
Maybe not for
Companies that need live data from an HRIS. These files use data you type or paste in, so they are best for monthly or quarterly reporting.
Which version is right for you?
All three are free, formula-driven Excel files with sample data you can replace. They are independent, so you can download more than one.
Version 1
HR Dashboard
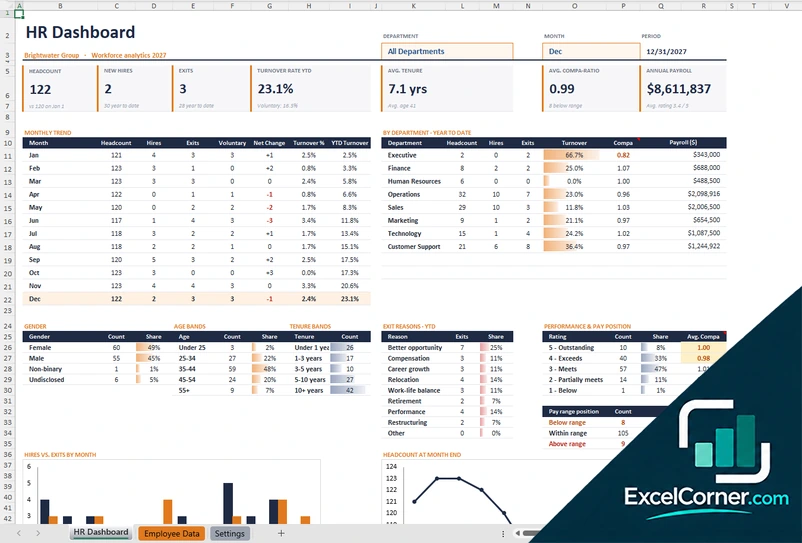
Build an HR analytics dashboard from a list of employees, with headcount, turnover, demographics and pay position.
HR DashboardEmployee DataSettings
.xlsx · 130 KB
Version 2
HR KPI Scorecard
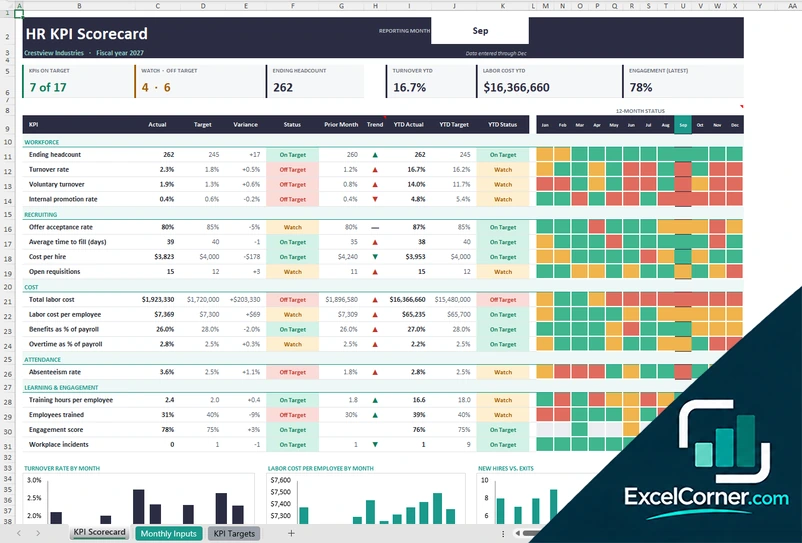
Track 17 HR metrics against targets, with a status for the month, the year to date and the last 12 months.
KPI ScorecardMonthly InputsKPI Targets
.xlsx · 43 KB
Version 3
HR Dashboard with KPI Scorecard
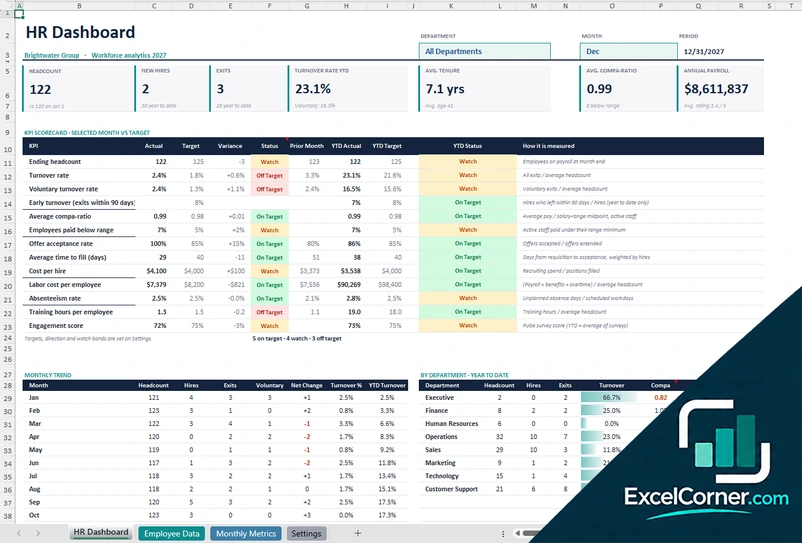
Filter by department and month, and see employee analytics together with a KPI scorecard measured against your targets.
HR DashboardEmployee DataMonthly MetricsSettings
.xlsx · 150 KB
What is inside the HR dashboard Excel templates
Version 1: HR Dashboard
On the Employee Data sheet you enter one row per employee, including people who left, with an exit date, type and reason. The HR Dashboard lets you filter by department and month and shows the headcount, new hires, exits, turnover rate for the year, average tenure, average compa-ratio and annual payroll. A monthly trend lists headcount, hires, exits, voluntary exits and turnover, a department table shows hires, exits, turnover, compa-ratio and payroll, and breakdowns cover gender, age bands, tenure bands, exit reasons and performance with pay position against the salary range. Charts show hires against exits and headcount at month end.
Version 2: HR KPI Scorecard
On the Monthly Inputs sheet you type each month’s figures, such as the headcount, new hires, voluntary and involuntary exits, promotions, open requisitions, offers, recruiting spend, payroll and benefits cost, overtime, absence days, training hours and the engagement score. On KPI Targets you set the target, the direction that counts as good, the watch band and the definition of each metric. The KPI Scorecard picks a reporting month and shows each KPI by category, with the actual result, the target, the variance, a status of on target, watch or off target, the prior month, a trend arrow and the year-to-date result, plus a 12-month status grid and charts for turnover, labor cost per employee and hires against exits.
Version 3: HR Dashboard with KPI Scorecard
The Employee Data sheet holds one row per employee, current or former, and Monthly Metrics holds the totals that do not come from the employee list, such as offers, recruiting spend, benefits, overtime, absence days, training hours and engagement. The HR Dashboard has department, month and period selectors and shows the headcount, hires, exits, turnover, tenure, compa-ratio and payroll. A KPI scorecard compares each metric with its monthly and year-to-date target, with a status and a note on how it is measured. Below it, a monthly trend and a department table support the view. The Settings sheet holds the departments, locations, job levels with salary ranges, exit reasons and the KPI targets with their watch bands.
How to use the HR dashboard template in Excel
- Download
Pick the version you want and open it in Excel. - Set up targets and lists
Enter your company name, departments, salary ranges and KPI targets on the Settings or KPI Targets sheet. Fill in the input cells; formula cells calculate on their own. - Add your data
Enter one row per employee, including people who left, or type the monthly figures such as hires, exits, payroll and training hours. - Read the dashboard
Choose a department, month or period, check the KPIs against their targets and look at the charts for trends.
Update the data at the end of each month and review the KPIs that are off target with the managers who own them.
Which HR dashboard template do you need?
| HR Dashboard | HR KPI Scorecard | HR Dashboard with KPI Scorecard | |
|---|---|---|---|
| Data you enter | One row per employee | Monthly totals | Employees plus monthly metrics |
| Best for | Headcount, turnover and demographics | Tracking KPIs against targets all year | One page with both views |
| You get | Trends, departments, exit reasons and pay position | On target, watch and off target status by month | Employee analytics and a KPI scorecard |
They are separate files, so you can use more than one.
Tips for a useful HR dashboard
- Define each metric once, for example turnover as exits divided by average headcount, and keep the definition fixed.
- Set a target and a watch band for every KPI so the status shows what needs attention.
- Keep former employees in the data with an exit date, type and reason so turnover history is complete.
- Look at voluntary and involuntary turnover separately, because they have different causes.
- Check pay against salary ranges with the compa-ratio before you review compensation.
- Limit the dashboard to the metrics that lead to a decision, and update it on a fixed schedule.
Frequently asked questions
Is this HR dashboard template for Excel free?
Yes. All three versions are free to download as .xlsx files. You do not need an account or an email address.
Which version should I choose?
Choose the HR Dashboard (Version 1) if you have a list of employees and want headcount, turnover, demographics and pay position. Choose the HR KPI Scorecard (Version 2) if you track monthly totals and want each KPI against a target with a 12-month status. Choose the HR Dashboard with KPI Scorecard (Version 3) for both in one workbook. They are separate files, so you can use more than one.
Which HR metrics does the dashboard include?
The templates include headcount, new hires, exits, turnover, voluntary turnover, tenure, compa-ratio, payroll and labor cost. The KPI scorecards add offer acceptance rate, time to fill, cost per hire, open requisitions, absenteeism, training hours and engagement.
How is turnover calculated?
Turnover is the number of exits divided by the average headcount for the period. The dashboards show the monthly rate and the year-to-date rate, and they also show the voluntary share.
What is a compa-ratio?
The compa-ratio compares an employee’s pay with the midpoint of the salary range for their job level. A ratio of 1.00 means pay is at the midpoint, and the dashboard also counts employees paid below the range minimum.
Does the template work in Google Sheets?
The files are made for Microsoft Excel and use standard formulas with no macros. You can upload them to Google Drive and open them with Google Sheets, but some formatting or charts may look different.
Is my employee information stored online?
No. The templates are plain Excel files, so the data you type stays in your own file on your own computer. Protect the file because it can contain personal information.
More free HR and workforce templates
These templates contain sample data. Employee data is sensitive, so follow the privacy and employment laws that apply to you and protect the file. Excel is a trademark of Microsoft Corporation; Excel Corner is not affiliated with Microsoft.