
Home › HR & Workforce Management › Commission Excel Template
Previewing: Version 1 · Tiered Commission Tracker. Pick another version on the right.
Instant download · No sign-up · No email
Use this free commission template for Excel to calculate what your sales reps earn. Set up tiered commission plans, log the sales and let the formulas work out the payout, quota attainment and statements. Pick the version that fits how your plan pays.
Choose your version
- File
- .xlsx · 100 KB · 5 sheets
- Works with
- Microsoft Excel (.xlsx)
- Macros
- None · formulas only
- Price
- Free
Calculate sales commissions in Excel with tiers and quotas
A commission spreadsheet turns sales results into payouts. You define the plan, for example a rate that increases as a rep reaches higher percentages of quota, log each deal, and the spreadsheet calculates the commission, any bonus or SPIFF and the total for each rep.
These Excel commission templates support three approaches. The first uses monthly marginal tiers with a sales ledger, an annual matrix and a statement for each rep. The second is a quarterly incentive plan with a payout curve, a cap and an annual kicker, with a simulator to test the plan cost. The third is a commission performance dashboard with a choice of tiered, retroactive or flat-rate calculation, a cap, a draw and a rep statement.
Best for
- Sales managers who run monthly or quarterly commission plans
- Finance and HR teams that need to calculate and check commission payouts
- Small businesses that pay a percentage of sales to reps or agents
Maybe not for
Companies that need commissions to flow into a payroll system automatically. These files calculate the amounts, and you still enter them into payroll.
Which version is right for you?
All three are free, formula-driven Excel files with sample data you can replace. They are independent, so you can download more than one.
Version 1
Tiered Commission Tracker
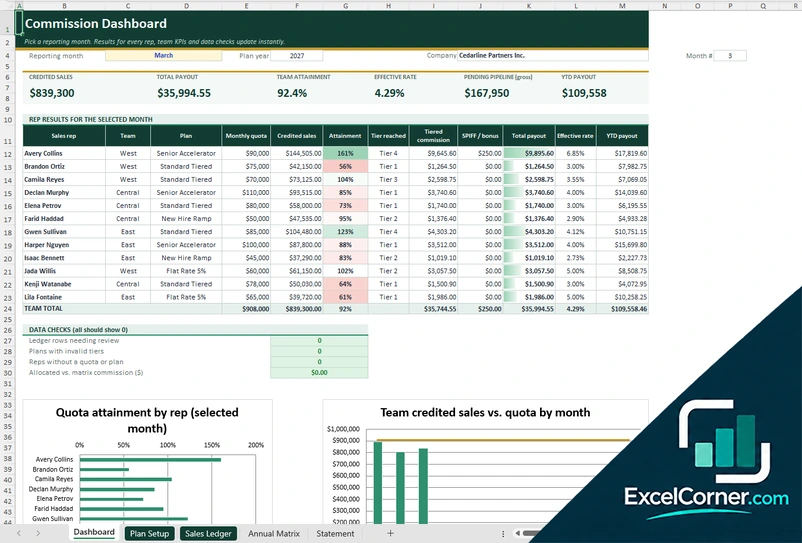
Define tiered commission plans, log deals and see each rep’s attainment, tier reached, commission and payout by month.
DashboardPlan SetupSales LedgerAnnual MatrixStatement
.xlsx · 100 KB
Version 2
Quarterly Incentive Plan
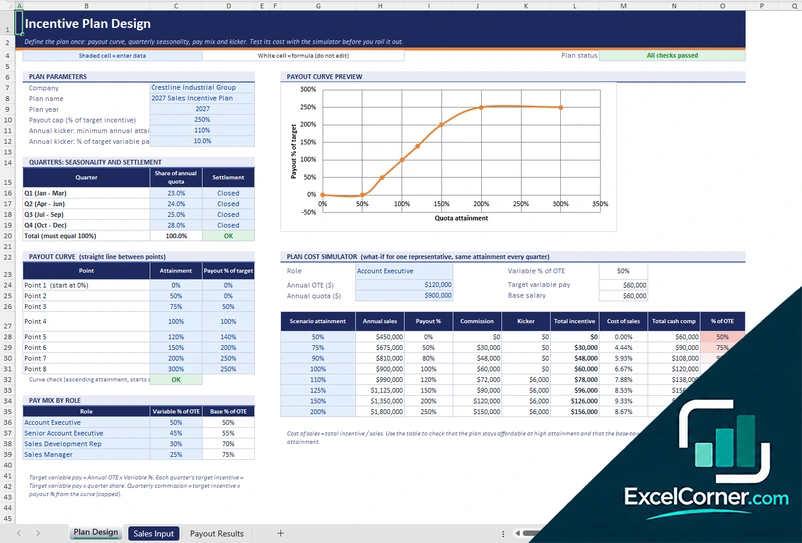
Design a quarterly incentive plan with a payout curve, a cap and an annual kicker, and test its cost before you roll it out.
Plan DesignSales InputPayout Results
.xlsx · 35 KB
Version 3
Commission Dashboard
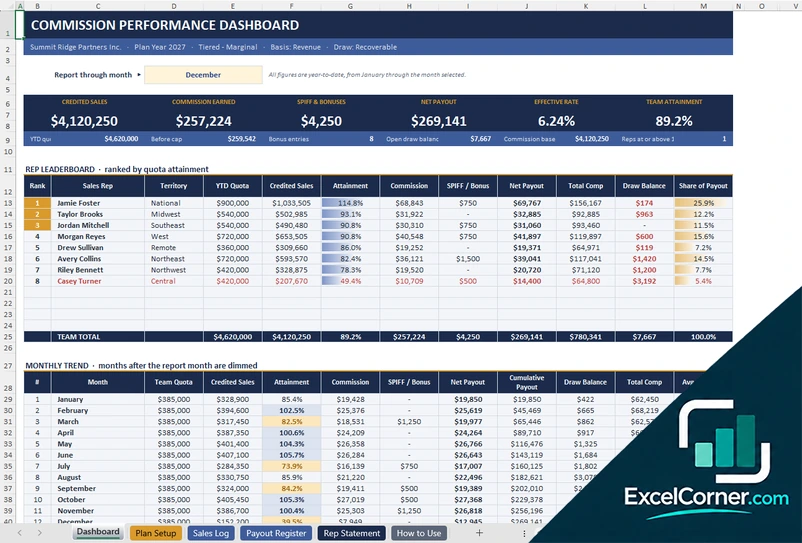
Choose a tiered, retroactive or flat-rate method, then see a leaderboard, a monthly trend and a statement for each rep.
DashboardPlan SetupSales LogPayout RegisterRep StatementHow to Use
.xlsx · 408 KB
What is inside the commission Excel templates
Version 1: Tiered Commission Tracker
On the Plan Setup sheet you define the commission plans with marginal tiers, where each slice of credited sales earns the rate of its tier, the deal categories with a credit multiplier, and the sales team of up to 12 reps with their plan and monthly quota. In the Sales Ledger you add one row per deal with the category, the amount, the credit split, the status and any SPIFF or bonus. Closed deals add credit, clawbacks subtract it and pending deals show as pipeline. The Dashboard lets you pick a month and shows the credited sales, the total payout, the team attainment, the effective rate, the pending pipeline and the year-to-date payout, with the results for each rep. The Annual Matrix shows the whole year and the Statement prints one rep’s commission.
Version 2: Quarterly Incentive Plan
On the Plan Design sheet you set the payout cap as a percentage of target incentive, the annual kicker, the share of the annual quota for each quarter and the settlement status, a payout curve with eight points that you can see in a chart, and the pay mix for each role. A cost simulator shows the commission, kicker, total incentive and cost of sales for one representative at different levels of attainment. You enter each rep’s quota and quarterly sales on the Sales Input sheet. The Payout Results sheet settles each quarter and calculates the annual true-up and the total compensation, with the total sales, the total incentive payout, the cost of sales, the payout against the variable budget and the number of reps at or above 100 percent.
Version 3: Commission Dashboard
On the Plan Setup sheet you choose the calculation method, which is tiered marginal, tiered retroactive or flat rate, the commission basis, either revenue or gross margin, the commission trigger, a monthly cap per rep, the draw type and the payment lag. You also enter up to five commission tiers based on quota attainment and test them in a tier simulator. Sales, bonuses and draws are logged on the Sales Log, and the Payout Register summarizes the payouts. The Dashboard shows the credited sales, the commission earned, the SPIFFs and bonuses, the net payout, the effective rate and the team attainment, with a rep leaderboard ranked by quota attainment and a monthly trend. The Rep Statement prints a statement for one rep.
How to use the commission template in Excel
- Download
Pick the version you want and open it in Excel. - Define your plan
Enter the commission tiers, rates and quotas for each rep or plan. Fill in the input cells; formula cells calculate on their own. - Log the sales
Add each deal with its date, rep, amount and status, or enter the sales by quarter. - Review the payouts
Check quota attainment, commission and total payout for each rep, and print the statements.
Test a new plan with the simulator or with sample numbers before you announce it to the team.
Which commission template do you need?
| Tiered Commission Tracker | Quarterly Incentive Plan | Commission Dashboard | |
|---|---|---|---|
| Plan type | Monthly marginal tiers by plan | Quarterly payout curve with a cap and a kicker | Tiered, retroactive or flat rate |
| Best for | Several plans and a sales ledger | Testing the cost of an incentive plan | A dashboard with a leaderboard and statements |
| You get | Rep results, annual matrix and statement | Quarterly settlement and an annual true-up | Leaderboard, payout register and rep statements |
They are separate files, so you can use more than one.
Tips for a fair commission plan
- Keep the plan simple enough that reps can calculate their own commission.
- Set quotas from real data and review them for each plan period.
- Decide how refunds and cancelled deals are handled, for example with a clawback.
- Cap the payout or test the plan cost, so a few big deals do not break the budget.
- Share the rules in writing, and give reps a statement that shows how the number was reached.
- Review the plan every year and compare the cost of sales with your targets.
Frequently asked questions
Is this commission template for Excel free?
Yes. All three versions are free to download as .xlsx files. You do not need an account or an email address.
Which version should I choose?
Choose the Tiered Commission Tracker (Version 1) for monthly marginal tiers with several plans, a sales ledger and rep statements. Choose the Quarterly Incentive Plan (Version 2) to design a payout curve with a cap and an annual kicker and test its cost. Choose the Commission Dashboard (Version 3) for a leaderboard, a payout register, a draw and a choice of calculation methods. They are separate files, so you can use more than one.
What is a tiered commission structure?
In a tiered structure the commission rate increases as the rep reaches higher levels of quota. With marginal tiers, each slice of sales is paid at the rate of the tier it falls in, so reaching a higher tier does not change the pay on earlier sales.
Can I use a flat commission rate?
Yes. The Commission Dashboard has a flat rate option, and the Tiered Commission Tracker includes a flat rate plan. You can also create a tiered plan where every tier has the same rate.
Does it handle refunds, SPIFFs and draws?
Yes. The Tiered Commission Tracker lets you enter a clawback for a reversed deal and a SPIFF or bonus for a closed deal. The Commission Dashboard also supports a monthly cap and a draw that is recoverable or non-recoverable.
Does the template work in Google Sheets?
The files are made for Microsoft Excel and use standard formulas with no macros. You can upload them to Google Drive and open them with Google Sheets, but some formatting or charts may look different.
Is my sales data stored online?
No. The templates are plain Excel files, so the names, sales and payouts you type stay in your own file on your own computer.
These templates are calculation tools with sample data. Commission plans can have legal and tax implications, so review your plan with a qualified professional. Excel is a trademark of Microsoft Corporation; Excel Corner is not affiliated with Microsoft.