
Home › Project Management › Capacity Analysis Template Excel
Previewing: Version 1 · Workforce Capacity Plan. Pick another version on the right.
Instant download · No sign-up · No email
Use these free capacity analysis templates for Excel to compare the work you have to deliver with the people available to do it. See which roles and months are overloaded, how many hires or contractor hours you need, and what the shortfall costs. One version analyzes capacity by role, one plans team capacity week by week, and one models demand and headcount under different scenarios.
Choose your version
- File
- .xlsx · 137 KB · 5 sheets
- Works with
- Microsoft Excel (.xlsx)
- Macros
- None · formulas only
- Price
- Free
Analyze team capacity in an Excel spreadsheet
Capacity analysis compares demand with supply. Demand is the work that has to be done, in hours. Supply is the time your people can actually spend on it, after holidays, leave and the share of the week that goes to other things. The gap between the two tells you whether the team is overloaded, balanced or has spare time, and when and where it happens.
These capacity analysis Excel templates cover three ways to do that. The first is a capacity plan by role and month, with project demand, a team roster with start and end dates, a utilization heat map and a hiring recommendation for each role. The second is a team capacity planner that shows each person’s utilization week by week against their assigned project hours. The third is a demand and capacity model for a team that works in volumes, with scenarios for growth, attrition and shrinkage, and the cost of closing the gap.
Best for
- Managers and PMO teams that need to know whether they can take on more work
- Resource and workforce planners who decide when to hire or use contractors
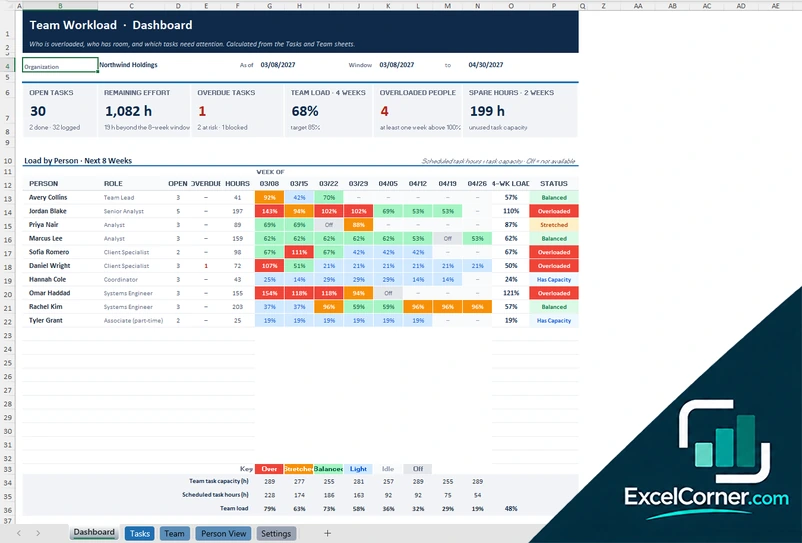
- Team leads who plan weekly workloads and look for people who are overbooked
Maybe not for
Detailed task scheduling or timesheets. These templates work with hours of demand and capacity, not with individual tasks or time entries.
Which version is right for you?
All three are free, formula-driven Excel files with sample data you can replace. They are independent, so you can download more than one.
Version 1
Workforce Capacity Plan
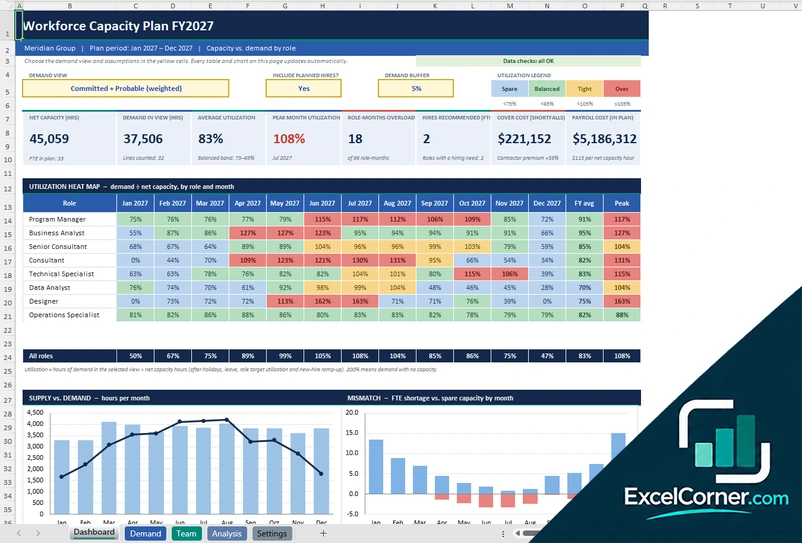
Compare project demand with net team capacity by role and month, see a utilization heat map and get a hiring and cover plan for each role.
DashboardDemandTeamAnalysisSettings
.xlsx · 137 KB
Version 2
Team Capacity Planner
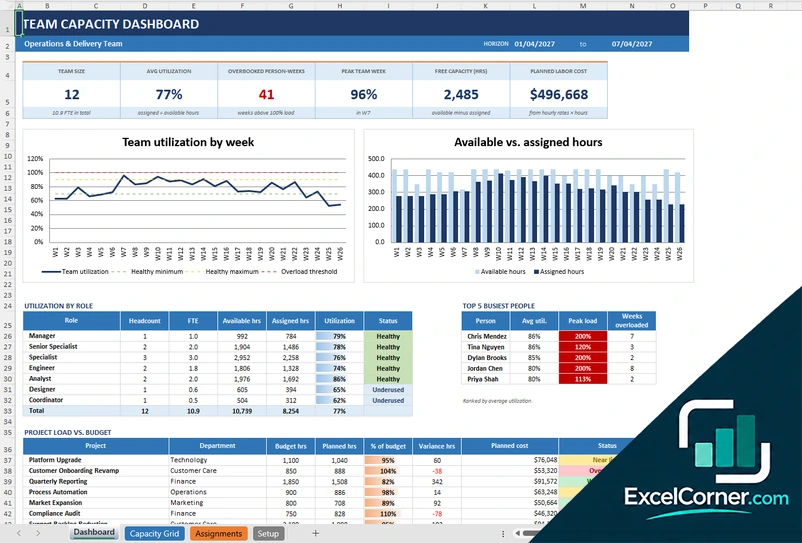
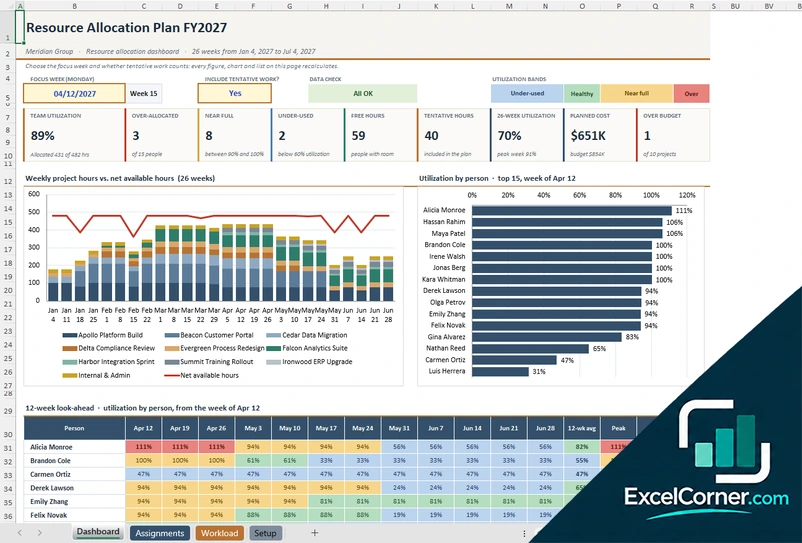
Assign project hours to people and see their utilization week by week, who is overbooked and how each project compares with its budget.
DashboardCapacity GridAssignmentsSetup
.xlsx · 72 KB
Version 3
Demand vs. Capacity Model
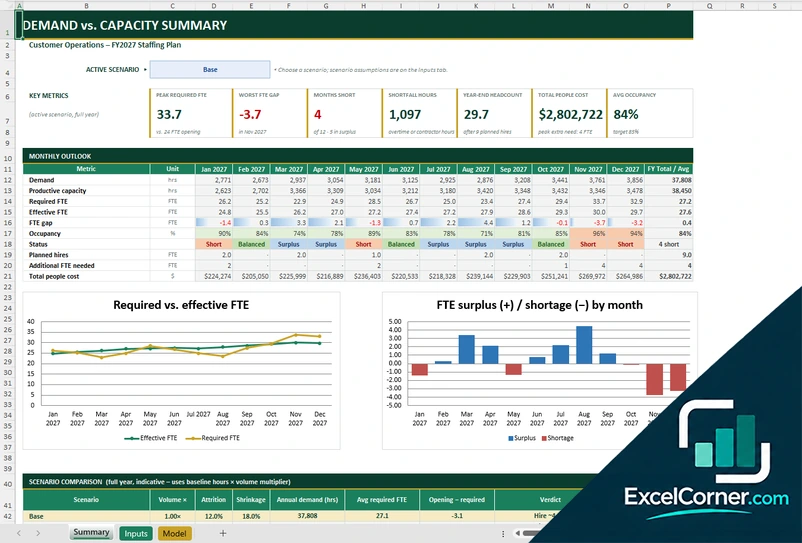
Turn volumes of work into hours and required FTE, compare scenarios and see the gap, the hiring plan and the cheapest way to cover a shortfall.
SummaryInputsModel
.xlsx · 34 KB
What is inside the capacity analysis Excel templates
Version 1: Workforce Capacity Plan
The Settings sheet holds the plan title, the plan start month, the working hours per day, the contractor cost premium, the new-hire ramp-up, the roles with their rates and target utilization, the utilization bands and the hiring rule. The Demand sheet lists each project and role with its status, probability, dates and total hours, and spreads the hours across the months by working days. The Team sheet lists each person with the role, start and end dates, hourly cost and planned leave, and calculates the net hours. The Analysis sheet calculates the supply, the demand, the utilization, the gap in hours and in FTE, the cover cost, the payroll cost and a set of model checks. The Dashboard shows the net capacity, the demand, the average and peak utilization, the role-months overloaded, the hires recommended, a utilization heat map, two charts and a role action plan.
Version 2: Team Capacity Planner
The Setup sheet holds the planning start, the standard hours per week, the healthy utilization range, the overload threshold, the roles, the team roster with the weekly capacity and hourly cost, the projects with their budget hours and the company holidays. The Assignments sheet lists the planned hours for each person and project. The Capacity Grid shows the utilization, the free capacity, the available hours and the assigned hours for every person and week, with a time-off input. The Dashboard shows the team size, the average utilization, the overbooked person-weeks, the peak week, the free capacity and the planned labor cost, with the utilization by role, the five busiest people, the project load against budget and two charts.
Version 3: Demand vs. Capacity Model
The Inputs sheet holds the model name, the first month, the hours per working day, the scenarios with a volume multiplier, attrition and shrinkage, the opening headcount, the target occupancy, the new-hire productivity, the loaded cost per FTE, the overtime premium, the contractor rate, the recruiting cost and the work types with their baseline volumes. The Model sheet calculates the demand in units and hours, the capacity per FTE, the headcount with attrition and planned hires, the supply against demand, the required FTE, the FTE gap, the occupancy and the cost of closing the gap by overtime or contractors. The Summary shows the active scenario, the peak required FTE, the worst gap, the months short, the shortfall hours, the total people cost, a monthly outlook, a scenario comparison and two charts.
How to use a capacity analysis template in Excel
- Download
Pick the version you want and open it in Excel. The files have sample data so you can see how each sheet works. - Set the plan parameters
On the Settings or Setup sheet, enter the plan start, the working hours, the holidays, the roles with their rates and the utilization limits that define a healthy load. - Enter the supply
List your people or your opening headcount, with their roles, start and end dates and planned leave. - Enter the demand
Add the projects or the work types with the hours, the role required, the dates and, if you use them, the status or the probability of the work. - Read the analysis
Check the dashboard for utilization, overloaded months, the gap in hours and in FTE, and the hires or cover needed, then change the assumptions and compare.
Change a date, a headcount or an assumption and the utilization, the gap and the charts update.
Which capacity analysis template do you need?
| Workforce Capacity Plan | Team Capacity Planner | Demand vs. Capacity Model | |
|---|---|---|---|
| For | Capacity by role and month | Weekly load by person | Staffing a team that works in volumes |
| Best for | Planning hires and cover for a portfolio of projects | Team leads balancing weekly assignments | Operations and service teams with scenarios |
| Main outputs | Utilization heat map, gap in FTE, hires and cover cost | Utilization by week, overload and project load vs. budget | Required vs. effective FTE, scenarios and people cost |
| Sheets | 5 | 4 | 3 |
| Charts | 2 | 2 | 2 |
They are separate files, so you can use more than one.
Tips for capacity analysis
- Use net capacity, not the number of hours in a contract. Take out holidays, planned leave and time spent on meetings and training.
- Decide what a healthy utilization is for each role, and let the template flag the months above it. Most teams cannot run at 100 percent for long.
- Weight uncertain work by its probability, so a project that might start counts for less than one that has been approved.
- Look at the gap by role and by month. A team that is balanced on average can still be overloaded in one role in one quarter.
- Compare the cost of hiring, overtime and contractors before you decide how to close a gap.
- Update the plan whenever a project is approved, delayed or canceled, and review it at the same time each month.
Frequently asked questions
Is this capacity analysis template for Excel free?
Yes. All three versions are free to download as .xlsx files. You do not need an account or an email address.
Which version should I choose?
Choose the Workforce Capacity Plan (Version 1) to compare demand and capacity by role and month and to plan hires. Choose the Team Capacity Planner (Version 2) to plan the weekly load of each person. Choose the Demand vs. Capacity Model (Version 3) to model staffing for a team that works in volumes, with scenarios.
How is capacity calculated?
Capacity is the available time of each person after holidays, planned leave and, in the demand model, shrinkage and the target occupancy. In the workforce plan, a new hire can work at reduced productivity during a ramp-up period.
How is utilization calculated?
Utilization is the demand hours divided by the net capacity hours, or the assigned hours divided by the available hours. You set the limits for spare, balanced, tight and overloaded on the settings sheet.
How does the template recommend hires?
The Workforce Capacity Plan counts the months of shortfall for each role. If the shortfall lasts longer than the number of months you set, it recommends a hire. Shorter shortfalls are shown as cover cost for overtime or contractors.
Can I compare scenarios?
Yes. The Demand vs. Capacity Model has a scenario selector with a base case, high growth and low growth, each with its own volume multiplier, attrition and shrinkage, and a comparison table of the annual results.
Does the template work in Google Sheets?
The files are made for Microsoft Excel and use standard formulas with no macros. You can upload them to Google Drive and open them with Google Sheets, but some formatting or charts may look different.
Is my project information stored online?
No. The templates are plain Excel files, so the costs, names and dates you type stay in your own file on your own computer.
More free resource and workforce planning templates
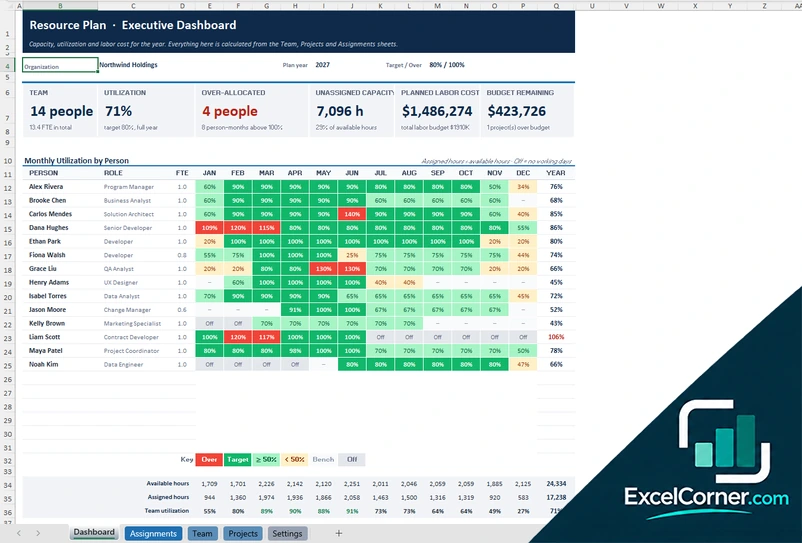
These templates are planning and record-keeping tools with sample data. Check the figures against your contracts, invoices and accounting records before you rely on them. Excel is a trademark of Microsoft Corporation; Excel Corner is not affiliated with Microsoft.