
Home › Project Management › RAID Log Template Excel
Previewing: Version 1 · RAID Log Workbook. Pick another version on the right.
Instant download · No sign-up · No email
Use these free RAID log templates for Excel to track project risks, assumptions, issues and dependencies in one workbook. Score each item, see a risk heat map and the open exposure, and find the items that are overdue. One version is a dashboard with a single log, one is a one-register report, and one gives each RAID type its own tab.
Choose your version
- File
- .xlsx · 99 KB · 8 sheets
- Works with
- Microsoft Excel (.xlsx)
- Macros
- None · formulas only
- Price
- Free
Manage a RAID log in an Excel spreadsheet
RAID stands for risks, assumptions, issues and dependencies. A RAID log keeps the four lists together, so a project manager can see what could go wrong, what the plan takes for granted, what is going wrong now and what depends on other teams. A spreadsheet works well for this because the scoring, the colors and the summary can be calculated from the rows.
These RAID log Excel templates cover three layouts. The first workbook includes two complete layouts: a dashboard over one combined log, and a version with a separate sheet for each type. The second is a single RAID register with a one-page report, a heat map and the top exposures. The third is a workbook with a tab for risks, assumptions, issues and dependencies and an overview of all four, with inherent and residual risk scores.
Best for
- Project managers who report project risks and issues to a sponsor
- PMO teams that want one consistent RAID register across projects
- Teams that track dependencies on vendors and other departments
Maybe not for
A full enterprise risk management program with controls and audit trails. These templates keep a project RAID log in Excel.
Which version is right for you?
All three are free, formula-driven Excel files with sample data you can replace. They are independent, so you can download more than one.
Version 1
RAID Log Workbook
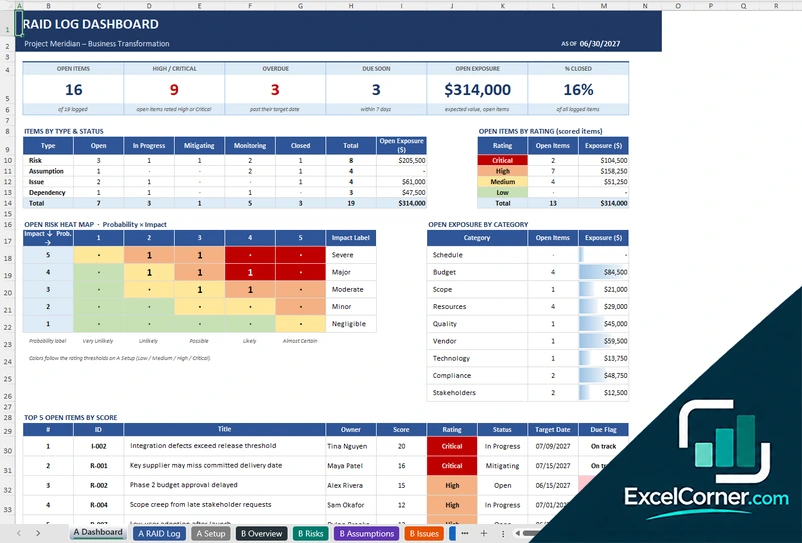
Keep risks, assumptions, issues and dependencies in one log with a dashboard, a heat map and the top five open items. Includes a second layout with one tab for each type.
A DashboardA RAID LogA SetupB OverviewB RisksB AssumptionsB IssuesB Dependencies
.xlsx · 99 KB
Version 2
RAID Report and Register
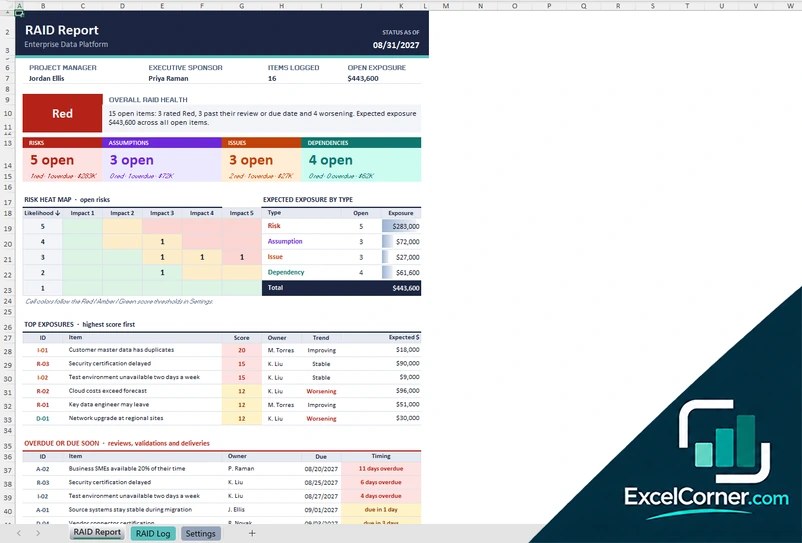
Record all four RAID types in one register and get a one-page report with the overall health, a heat map, the top exposures and overdue items.
RAID ReportRAID LogSettings
.xlsx · 66 KB
Version 3
RAID Workbook by Type
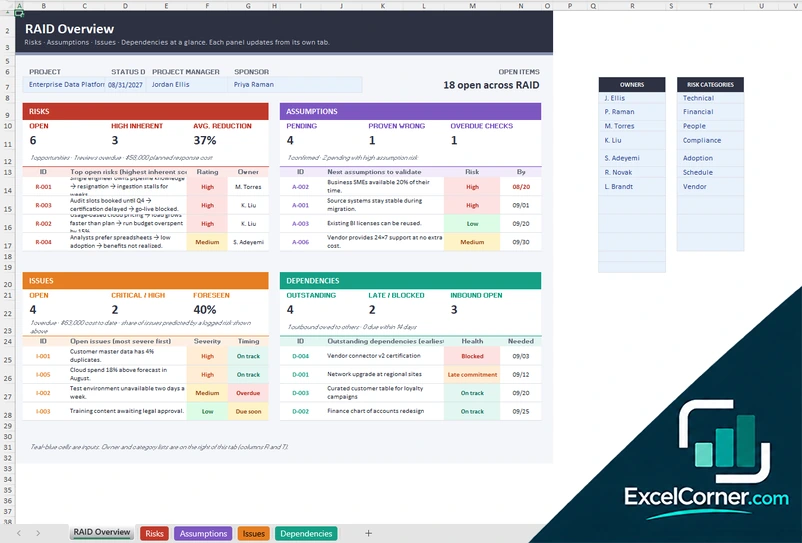
Give risks, assumptions, issues and dependencies their own tab, with inherent and residual risk scores and an overview of all four.
RAID OverviewRisksAssumptionsIssuesDependencies
.xlsx · 79 KB
What is inside the RAID log Excel templates
Version 1: RAID Log Workbook
The workbook contains two complete layouts, labeled A and B. Layout A has a Setup sheet with the project information, the probability scale and the drop-down lists, a RAID Log with one row for each item (type, title, category, owner, dates, status, probability, impact, score, rating, response, cost exposure and expected value), and a Dashboard with the open items, the high and critical items, the overdue and due-soon items, the open exposure, the heat map, the exposure by category and the top five open items. Layout B has an Overview and separate Risks, Assumptions, Issues and Dependencies sheets, with the expected cost and delay, the SLA targets for issues and the slack for dependencies.
Version 2: RAID Report and Register
The Settings sheet holds the project, the project manager, the sponsor, the status date, the due-soon window, the look-ahead for dependencies, the exposure score thresholds and the lists of workstreams and owners. The RAID Log is one register in which you pick the type of each item, rate the likelihood and the impact and enter the cost if it happens. It calculates the score, the rating, the expected exposure, the days left and the timing. The RAID Report shows the overall RAID health, the open items by type, a risk heat map, the expected exposure by type, the top exposures, the items that are overdue or due soon, the inbound dependencies and the assumptions to validate.
Version 3: RAID Workbook by Type
The RAID Overview shows the project, the status date and the open items, with a panel for each type: the open and high inherent risks and the average reduction, the assumptions pending, proven wrong and overdue, the open and critical issues, and the outstanding and late dependencies. The Risks sheet scores the inherent risk, records the response and its cost, and scores the residual risk and the reduction. The Assumptions sheet records the confidence, the impact if wrong, how it will be validated and the result. The Issues sheet tracks the severity, the target date and the days open, and links an issue to a risk. The Dependencies sheet tracks the direction, the other party, the needed-by and committed dates, the slack and the health.
How to use a RAID log template in Excel
- Download
Pick the version you want and open it in Excel. The files have sample items so you can see how the sheets work. - Set up the project
On the Setup or Settings sheet, enter the project name, the project manager, the sponsor and the report date. Review the probability and impact scales, the rating thresholds and the lists of owners and categories. - Log the items
Add one row for each risk, assumption, issue or dependency with an owner, a date and a status. For risks, rate the probability and the impact and the template calculates the score and the rating. - Plan the response
Choose a response, write the action plan and set the review or target date. - Review the dashboard
Check the open items, the heat map, the top exposures and the items that are overdue or due soon, and update the report date each period.
Enter the TODAY function as the report date to keep the due flags current.
Which RAID log template do you need?
| RAID Log Workbook | RAID Report and Register | RAID Workbook by Type | |
|---|---|---|---|
| For | A dashboard over a combined log, or separate tabs | One register with a one-page report | A separate tab for each RAID type |
| Best for | Teams that want to try both layouts | Sponsor and steering reports | Detailed risk and dependency tracking |
| Main outputs | Heat map, top 5 items, exposure by category | RAID health, heat map, top exposures and timing | Inherent and residual risk, assumption checks, SLA and slack |
| Sheets | 8 | 3 | 5 |
| Charts | No (heat map) | No (heat map) | No |
They are separate files, so you can use more than one.
Tips for keeping a RAID log
- Write each risk as a cause, an event and an effect, so that it is clear what could happen and why it matters.
- Give every item one owner and a review date. Items without an owner are the ones that get forgotten.
- Score risks with the same probability and impact scales every time, so the ratings can be compared.
- Test assumptions early. An assumption that proves wrong becomes an issue.
- Record dependencies with the date you need them and the date they are promised. The gap is your slack.
- Review the RAID log in every project status meeting and close the items that are done.
Frequently asked questions
Is this RAID log template for Excel free?
Yes. All three versions are free to download as .xlsx files. You do not need an account or an email address.
Which version should I choose?
Choose the RAID Log Workbook (Version 1) if you want a dashboard and a choice of layouts. Choose the RAID Report and Register (Version 2) for one register and a one-page report. Choose the RAID Workbook by Type (Version 3) if you want a separate tab for risks, assumptions, issues and dependencies.
How is the risk score calculated?
The score is the probability multiplied by the impact, each rated from 1 to 5. The Setup or Settings sheet maps the score to a rating, such as red, amber and green, and you can change the thresholds.
What is the difference between a risk and an issue?
A risk is an uncertain event that might happen. An issue is a problem that is already happening. A risk that occurs becomes an issue, and the third version lets you link an issue to the risk that predicted it.
What does the heat map show?
The heat map is a grid of probability and impact. Each cell shows how many open risks sit at that combination, with colors that follow the rating thresholds.
Can I track dependencies on other teams?
Yes. All three versions track the other party, the date you need the deliverable and the status. Version 3 also calculates the slack in days and a health status.
Does the template work in Google Sheets?
The files are made for Microsoft Excel and use standard formulas with no macros. You can upload them to Google Drive and open them with Google Sheets, but some formatting or charts may look different.
Is my project information stored online?
No. The templates are plain Excel files, so the costs, names and dates you type stay in your own file on your own computer.
These templates are planning and record-keeping tools with sample data. Check the figures against your contracts, invoices and accounting records before you rely on them. Excel is a trademark of Microsoft Corporation; Excel Corner is not affiliated with Microsoft.