
Home › Marketing, Sales & Customers › Excel Sales Report Template
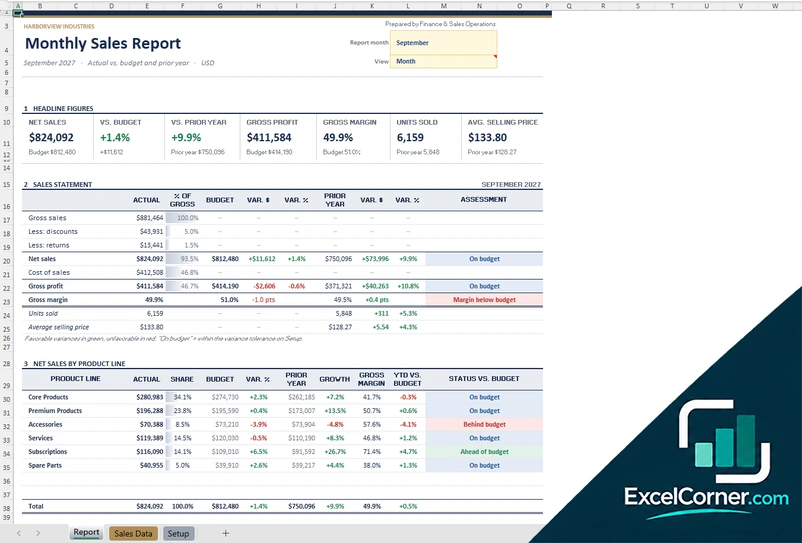
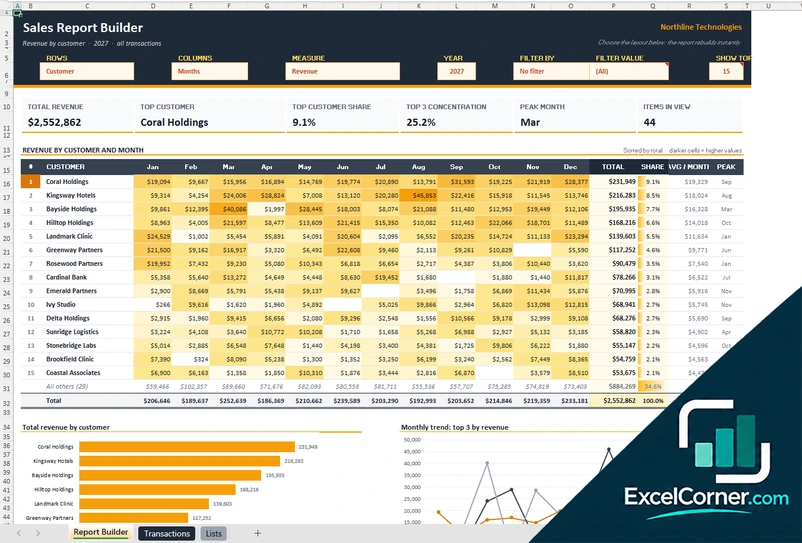
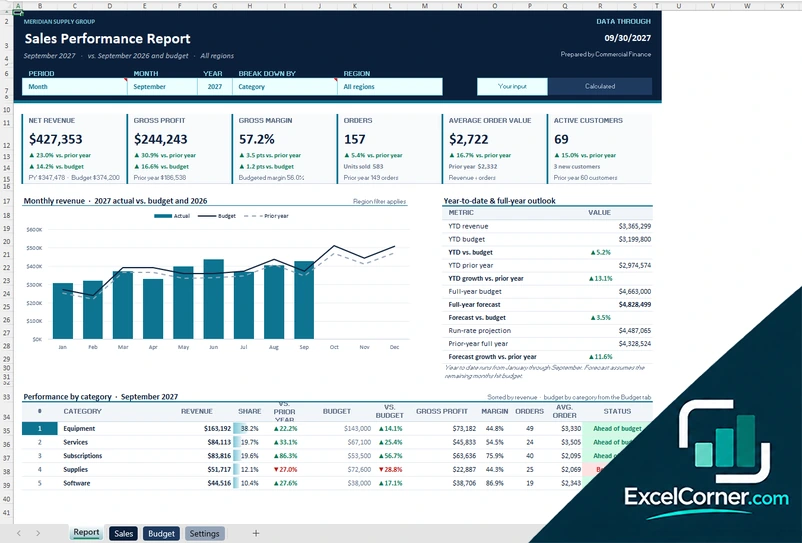
Previewing: Version 1 · Monthly Sales Report vs. Budget. Pick another version on the right.
Instant download · No sign-up · No email
Download these free sales report templates for Excel to report on revenue, margin and results without building a report from scratch. One version is a monthly sales report that compares actual sales with budget and the prior year, one is a report builder where you choose the rows, columns and measure, and one is a sales performance report with year-to-date results and a full-year forecast.
Choose your version
- File
- .xlsx · 117 KB · 3 sheets
- Works with
- Microsoft Excel (.xlsx)
- Macros
- None · formulas only
- Price
- Free
Build a sales report in an Excel spreadsheet
A sales report answers a few plain questions: how much did we sell, how does that compare with the plan and with last year, which products, customers and regions drove the result, and what is likely to happen next. Most teams build it by hand each month from an export of invoices or orders, and the work is repeated, slow and easy to get wrong. A template does the repeating part: you paste or type the sales data once, and the report, the comparisons and the charts update on their own.
These Excel templates cover three ways to report. The first is a monthly sales report in the shape of a management report: headline figures, a sales statement from gross sales to gross profit with variances against the budget and the prior year, a breakdown by product line and region, a monthly trend and a full-year outlook. The second is a sales report builder: you pick what to show in the rows, the columns and the measure, and the table, the heat map and the charts follow. The third is a sales performance report with a selector for the month and the way to break the results down, with revenue, margin, orders and customers, year-to-date results against budget and a full-year forecast.
Best for
- Sales managers and finance teams that send a monthly sales report to management
- Small business owners and sales reps who want to see sales by customer, product or region
- Analysts who need a flexible report that they can change without rebuilding it
Maybe not for
A BI tool or a CRM report that reads your sales data directly. These templates are Excel files: you paste your data into a data sheet, and the workbook does the calculations and the charts. They work well for teams that start from an Excel or CSV export.
Which version is right for you?
All three are free, formula-driven Excel files with sample data you can replace. They are independent, so you can download more than one.
Version 1
Monthly Sales Report vs. Budget
Choose the month and see net sales, gross profit and margin against the budget and the prior year, with a breakdown by product line and region and a full-year outlook.
ReportSales DataSetup
.xlsx · 117 KB
Version 2
Sales Report Builder
Pick what to show in the rows and columns, the measure and an optional filter, and the sales report rebuilds itself with totals, shares, top customers and charts.
Report BuilderTransactionsLists
.xlsx · 853 KB
Version 3
Sales Performance Report
Select the month and how to break down the results and see six KPIs, year-to-date against budget, a full-year forecast, performance by category and the top customers.
ReportSalesBudgetSettings
.xlsx · 1144 KB
What is inside the sales report Excel templates
Version 1: Monthly Sales Report vs. Budget
The Report sheet is a monthly sales report in management format. You choose the report month and the view. Seven headline figures show the net sales, the result against the budget and the prior year, the gross profit, the gross margin, the units sold and the average selling price. A sales statement then runs from gross sales, discounts and returns to net sales, cost of sales and gross profit, with the actual, the percentage of gross sales, the budget, the variance in dollars and in percent, the prior year and an assessment of each line. Net sales are broken down by product line with the share, the growth, the year-to-date result against budget and a status, and by region. A monthly trend with two charts, a full-year outlook based on the year to date plus the remaining budget, automatic highlights and a box for management commentary complete the report. The Sales Data sheet holds up to 1,000 rows by month, product line and region, with the units, the gross sales, the discounts, the returns, the net sales, the cost of sales, the budget and the prior-year figures. The Setup sheet holds the company, the rules and the lists of product lines and regions.
Version 2: Sales Report Builder
The Report Builder lets you build a sales report by choosing from lists: what to show in the rows, such as customer, product, sales rep, region or channel, what to show in the columns, such as months, the measure, such as revenue, gross profit or margin, the year, an optional filter and the number of rows to show. The table then lists the top items with the monthly figures as a heat map, a total, the share and an average, an item ranking and the peak month. Cards above it show the total revenue, the top customer and its share, the concentration of the top three, the peak month and the number of items in view. Two charts show the total revenue by item and the monthly trend of the top three, and a short list of automatic key takeaways sums up the result. The Transactions sheet holds up to 3,000 rows with the invoice number, the customer, the segment, the sales rep, the region, the channel, the product, the category, the payment plan, the unit price, the discount, the revenue, the gross profit and the margin. The Lists sheet holds your products and services, sales team, customer segments, channels and payment plans, with a short guide.
Version 3: Sales Performance Report
The Report sheet has selectors for the period, the month, the way to break down the results (for example by category or by region) and the region. Six cards show the net revenue, the gross profit, the gross margin, the number of orders, the average order value and the active customers, with the change from the budget and the prior year. A year-to-date and full-year outlook shows the year-to-date result against the budget, the growth over the prior year, the full-year forecast and how it compares with the budget. A chart compares the monthly revenue of the actual year, the budget and the prior year, and a performance table lists each category or region with the revenue, the share, the change from the prior year, the budget, the margin, the average order and a status. You also see the top customers with their change in dollars and a revenue breakdown by payment plan. The Sales sheet holds up to 4,500 orders with the customer, the segment, the sales rep, the region, the channel, the product, the category, the payment plan, the unit price, the discount, the net revenue and the gross profit. The Budget sheet holds the full-year budget by category and month and the share of each region, and the Settings sheet holds the company, the product catalog, the sales team and the lists.
How to use a sales report template in Excel
- Download
Pick the version you want and open it in Excel. The files have sample data for a made-up company, so you can see how each sheet works. - Set it up
On the setup or settings sheet, enter your company name and your lists, such as product lines, regions, sales reps and customer segments. - Paste your sales data
Replace the sample rows on the data sheet with your own sales, one row for each invoice, order or month, and for each product line and region where the template asks for it. - Choose the view
Select the month, the period or the measure at the top of the report. The tables and the charts change with your selection. - Read and share
Check the variances and the status, add your comments where there is a commentary box, and print or save the report as a PDF.
Replace the sample data with your own. The report, the variances, the rankings and the charts update on their own. A hidden calculation sheet feeds each report, and you do not need to edit it.
Which sales report template do you need?
| Monthly Sales Report vs. Budget | Sales Report Builder | Sales Performance Report | |
|---|---|---|---|
| For | A management report with variances | A flexible report you set up yourself | KPIs, year-to-date and a full-year forecast |
| Best for | Monthly reports to management | Sales by customer, product or rep | Teams that track budget and forecast |
| Data you enter | Up to 1,000 rows by month, product line and region | Up to 3,000 invoice or transaction rows | Up to 4,500 order rows plus a budget |
| Main outputs | Net sales, gross profit, variance vs. budget and prior year, product line and region tables | Table by customer and month, share, top customers, charts | Revenue, margin, orders, YTD vs. budget, forecast, top customers |
| Sheets | 3 | 3 | 4 |
| Charts | Yes | Yes | Yes |
They are separate files, so you can use more than one.
Tips for a better sales report
- Decide which figures matter before you start, such as net sales, gross margin, units and average price, and report the same ones every month.
- Always show a comparison, such as the budget or the same month last year, because a number alone says little.
- Report net sales after discounts and returns, and keep gross sales as a separate line.
- Break the result down by product, customer and region to see where the change comes from.
- Write one or two sentences of commentary on what changed and what you will do about it.
- Keep your data in one table with one row for each sale, so that you can change the report without changing the data.
- Check that the totals of the report match your accounting records before you share it.
Frequently asked questions
Are these sales report templates for Excel free?
Yes. All three versions are free to download as .xlsx files. You do not need an account or an email address.
Which version should I choose?
Choose the Monthly Sales Report (Version 1) for a management report that compares sales with the budget and the prior year. Choose the Sales Report Builder (Version 2) if you want to change the rows, the columns and the measure yourself, for example to see revenue by customer and month. Choose the Sales Performance Report (Version 3) for revenue, margin and orders with year-to-date results against budget and a full-year forecast.
What should a sales report include?
A good sales report shows the sales for the period, the comparison with a target and with a previous period, the margin, and a breakdown by product, customer, region or rep. It often ends with a short comment on what changed. The templates here include all of those parts.
How do I make a sales report in Excel?
Put your sales into one table with a row for each sale, and then summarize that table with formulas such as SUMIFS or with a pivot table. The templates do the summary for you: you paste the rows into the data sheet and choose the month or the view on the report.
Can I use my own products, customers and regions?
Yes. Each template has a setup or lists sheet where you enter your own product lines, customers, sales reps, regions and other lists. The report reads from those lists.
How many sales rows can the templates hold?
Version 1 holds up to 1,000 rows of monthly sales by product line and region, Version 2 holds up to 3,000 transactions and Version 3 holds up to 4,500 orders. If you have more data, you can summarize it by month first or keep a separate file for each year.
Do the sales report templates work in Google Sheets?
They use standard Excel formulas, so you can upload them to Google Drive and open them in Google Sheets, but some formatting and the interactive selectors may differ. They are made for Excel.
Does the template work in Google Sheets?
The files are made for Microsoft Excel and use standard formulas with no macros. You can upload them to Google Drive and open them with Google Sheets, but some formatting or charts may look different.
Is my information stored online?
No. The templates are plain Excel files, so the numbers, names and notes you type stay in your own file on your own computer.
More free sales and marketing templates
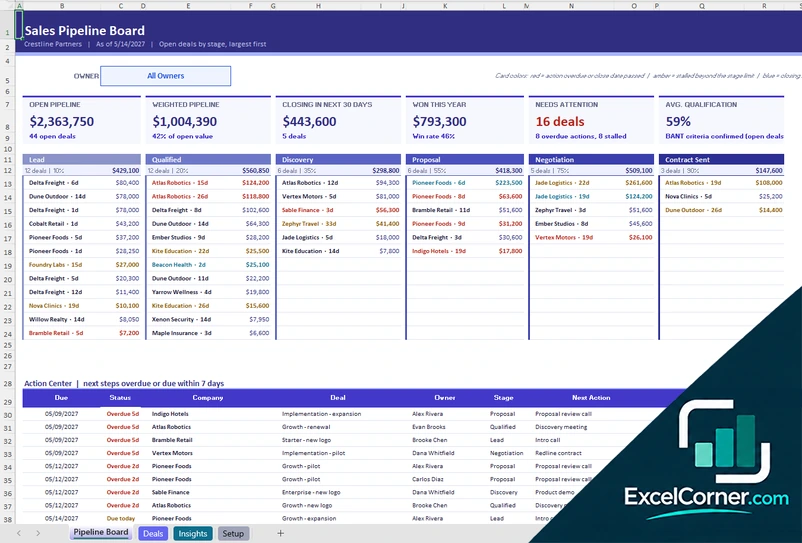
These templates are reporting and planning tools with made-up sample data. The figures, probabilities and forecasts depend on what you enter and are not a guarantee of future sales. Check them against your accounting and CRM records before you rely on them. Excel is a trademark of Microsoft Corporation; Excel Corner is not affiliated with Microsoft.