
Home › Marketing, Sales & Customers › Social Media Analytics Excel Template
Previewing: Version 1 · Social Media Analytics Report. Pick another version on the right.
Instant download · No sign-up · No email
Download these free social media analytics templates for Excel to turn your platform numbers into a clear report. One version is a performance report with a platform scorecard and a post log, one is a monthly dashboard that compares every metric with its target, and one is a post performance analyzer that benchmarks each platform, format and content pillar.
Choose your version
- File
- .xlsx · 235 KB · 4 sheets
- Works with
- Microsoft Excel (.xlsx)
- Macros
- None · formulas only
- Price
- Free
Report on your social media in an Excel spreadsheet
Social media analytics is the habit of measuring what your posts achieve: how many people saw them, how many reacted, how many clicked and how much came back in sales or sign-ups. The numbers already exist in each platform’s insights, but they sit in separate places and use different names. A spreadsheet brings them into one report where you can compare platforms, months and types of content, and where you decide what to post more of.
These Excel templates give you three ways to do that. The first is a social media performance report: you log every post once, and a dashboard shows impressions, reach, engagements, engagement rate, clicks, conversions and revenue for the month and platform you pick, with a platform scorecard, a 12-month trend and the top posts. The second is a monthly dashboard built on one row of data for each channel and month, which compares each KPI with its target and shows the status month to date and year to date. The third is a post performance analyzer: with filters for the dates, the platform and the format, it benchmarks the engagement rate of each platform, format and content pillar so you can see which kind of post works best.
Best for
- Social media managers and agencies that send a monthly report to a client or a boss
- Marketing teams that need to compare platforms, formats and campaigns in one place
- Small business owners and creators who want to know which posts are worth repeating
Maybe not for
A dedicated social media management or analytics platform that connects to your accounts and imports the data automatically. These templates do not connect to any platform: you copy the numbers from each platform’s insights, and the workbook does the calculations, the comparisons and the charts.
Which version is right for you?
All three are free, formula-driven Excel files with sample data you can replace. They are independent, so you can download more than one.
Version 1
Social Media Analytics Report
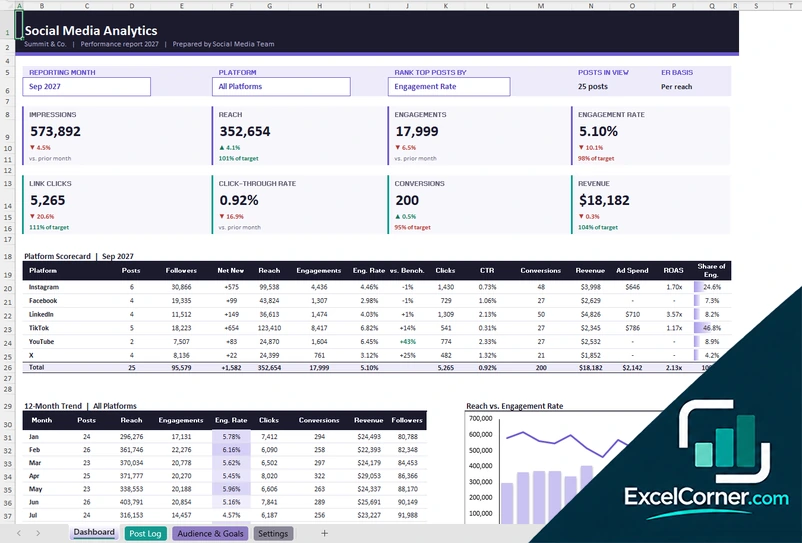
Pick a month and a platform and see eight KPIs against target, a platform scorecard, the 12-month trend, the top 5 posts, the format mix and the paid results.
DashboardPost LogAudience & GoalsSettings
.xlsx · 235 KB
Version 2
Monthly Analytics Dashboard
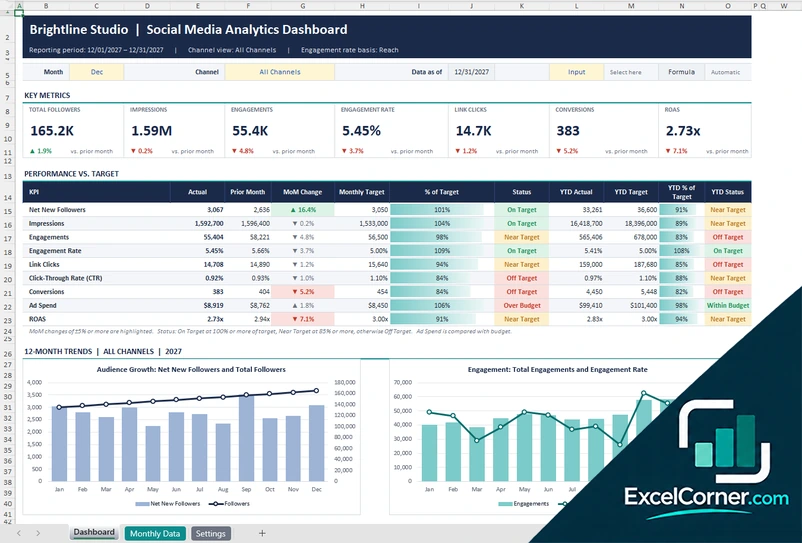
Choose the month and the channel and see the KPIs, the change from the previous month, the status against target, the year to date and the channel breakdown.
DashboardMonthly DataSettings
.xlsx · 56 KB
Version 3
Post Performance Analyzer
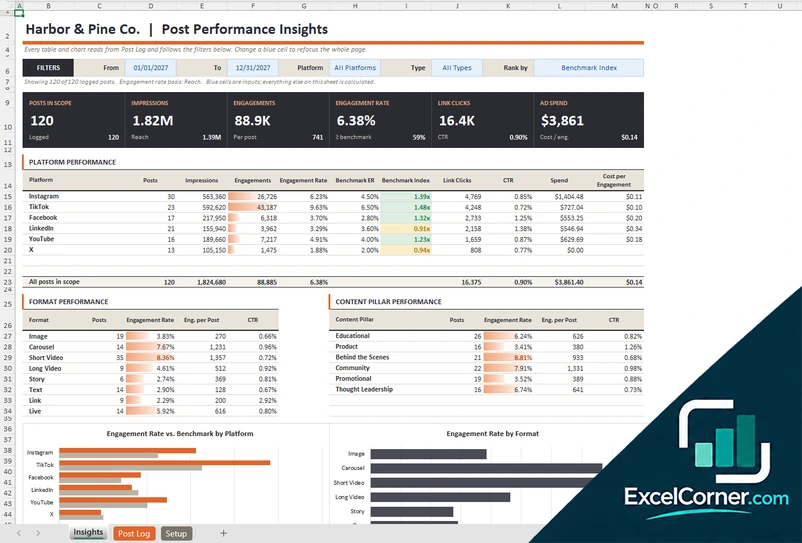
See which platform, format and content pillar get the best engagement rate against its benchmark, with the cost per engagement and charts that follow your filters.
InsightsPost LogSetup
.xlsx · 93 KB
What is inside the social media analytics Excel templates
Version 1: Social Media Analytics Report
The Dashboard lets you choose the reporting month, the platform and how to rank the top posts. Eight KPI cards show the impressions, reach, engagements, engagement rate, link clicks, click-through rate, conversions and revenue, with the change from the prior month and the percentage of target. A platform scorecard lists, for each platform, the posts, followers, net new followers, reach, engagements, engagement rate, the difference from the benchmark, clicks, click-through rate, conversions, revenue, ad spend, ROAS and the share of all engagement. Below it you find a 12-month trend table with a chart of reach and engagement rate, the top 5 posts of the month, the content format mix and the paid performance. The Post Log holds up to 1,000 posts, with the platform, format, content pillar, description, impressions, reach, reactions, comments, shares, clicks, video views, conversions, revenue and ad spend, and it calculates the engagements, the engagement rate, the conversion rate, the cost per click, the benchmark comparison and a rating for every post. The Audience & Goals sheet holds the followers at the end of each month for every platform and the monthly targets, and compares the actual results with them. The Settings sheet holds the brand, the platforms with their benchmark engagement rate, the formats and the content pillars.
Version 2: Monthly Analytics Dashboard
The Monthly Data sheet has one row for each channel and month. You enter the followers at the end of the month, the posts published, the impressions, the reach, the likes, comments and shares, the link clicks, the conversions, the ad spend and the revenue. The workbook calculates the net new followers, the follower growth, the total engagements, the engagement rate, the engagements per post, the conversion rate, the cost per click, the cost per conversion and a data check for every row. The Dashboard lets you pick the month and the channel and shows seven key metrics with the change from the prior month, followed by a performance table for nine KPIs. For each KPI it shows the actual value, the prior month, the change, the monthly target and the percentage of target with a status (on target, near target, off target or over budget), plus the year-to-date actual, target and status. Two charts show the net new followers with the total followers, and the engagements with the engagement rate over 12 months. A channel breakdown for six channels and a monthly trend table complete the sheet. The Settings sheet holds the brand, the year, the targets and the reference lists.
Version 3: Post Performance Analyzer
The Post Log holds up to 300 posts. For each one you enter the date, the time slot, the platform, the format, the content pillar, the campaign, the title or hook, the impressions, the reactions, comments and shares, the link clicks, the video views and the spend. The sheet calculates the weekday, the engagements, the engagement rate, the benchmark index, the view rate, the cost per engagement and whether the post is in scope. The Insights sheet has filters for the start date, the end date, the platform, the post type and the ranking. Six cards show the posts in scope, the impressions, the engagements, the engagement rate against the benchmark, the link clicks and the ad spend. Tables then compare the platforms, the formats and the content pillars, with the engagement rate, the engagements per post and the click-through rate, and a benchmark index in green or amber that tells you which ones beat their benchmark. Three charts show the engagement rate against the benchmark by platform, the engagement rate by format and the engagement rate by month. The Setup sheet explains the three steps and holds the account name, the reporting year and the benchmark engagement rate of each platform.
How to use a social media analytics template in Excel
- Download
Pick the version you want and open it in Excel. The files have sample data for a made-up brand, so you can see how every sheet works. - Set it up
On the settings sheet, enter the brand, the reporting year, your platforms and, where the template asks for them, the benchmark engagement rate and the monthly targets. - Enter your data
Copy the numbers from each platform’s insights into the yellow or blue input cells, one row for each post or for each channel and month. - Pick a view
Choose the month, the platform or the date range on the dashboard. Every table and chart changes with your selection. - Read the results
Look at the engagement rate, the status against target and the best posts, and decide what to post more of next month.
Replace the sample data with your own. The calculated columns, the dashboards and the charts update on their own.
Which social media analytics template do you need?
| Social Media Analytics Report | Monthly Analytics Dashboard | Post Performance Analyzer | |
|---|---|---|---|
| For | A monthly report with scorecard, trend and top posts | KPIs against monthly and year-to-date targets | Finding which platform, format and pillar work best |
| Best for | Client and management reports | Tracking goals month by month | Deciding what to post next |
| Data you enter | One row for each post, followers and targets | One row for each channel and month | One row for each post |
| Main outputs | Platform scorecard, 12-month trend, top 5 posts, format mix, paid results | Status vs. target, month over month, year to date, channel breakdown | Benchmark index, engagement by platform, format and pillar, cost per engagement |
| Sheets | 4 | 3 | 3 |
| Charts | Yes | Yes | Yes |
They are separate files, so you can use more than one.
Tips for social media analytics
- Decide on a few metrics that match your goal before you start, such as reach for awareness, engagement rate for interest and conversions for results.
- Use the same engagement rate formula every month. Dividing by reach, by impressions or by followers gives different numbers.
- Compare each platform with its own benchmark, because a good engagement rate on one platform can be an average one on another.
- Look at posts in groups, such as by format or content pillar, to see patterns instead of single results.
- Record paid and organic posts separately so that ad spend does not hide what works on its own.
- Update the numbers on a fixed day each month, so that the trends compare like with like.
- Write down what you will change after each report, and check it in the next one.
Frequently asked questions
Are these social media analytics templates for Excel free?
Yes. All three versions are free to download as .xlsx files. You do not need an account or an email address.
Which version should I choose?
Choose the Social Media Analytics Report (Version 1) for a monthly report with a platform scorecard, a trend and the top posts. Choose the Monthly Analytics Dashboard (Version 2) if you track results against monthly targets and want year-to-date status. Choose the Post Performance Analyzer (Version 3) to compare platforms, formats and content pillars against benchmarks and find what works best.
What is social media analytics?
Social media analytics is the measurement of what your posts and accounts achieve, such as impressions, reach, engagements, link clicks, followers and conversions. It helps you see what works so that you can repeat it and stop what does not.
Which social media metrics should I track?
Most reports start with impressions or reach, engagements, engagement rate, link clicks, followers gained and conversions. If you run ads, add the spend, the cost per click and the return on ad spend. All three templates calculate these for you from the numbers that you enter.
How is the engagement rate calculated?
The engagement rate is the engagements, which are reactions, comments, shares and similar actions, divided by a base. The templates let you choose the base, such as the reach, and show which base they use, so that the rate stays comparable from month to month.
Can I import the data from Instagram, Facebook or LinkedIn?
The templates do not connect to any platform. You copy the numbers from each platform’s insights or from its export and paste them into the input cells, and the workbook calculates the rest.
Can I use these templates for a client report?
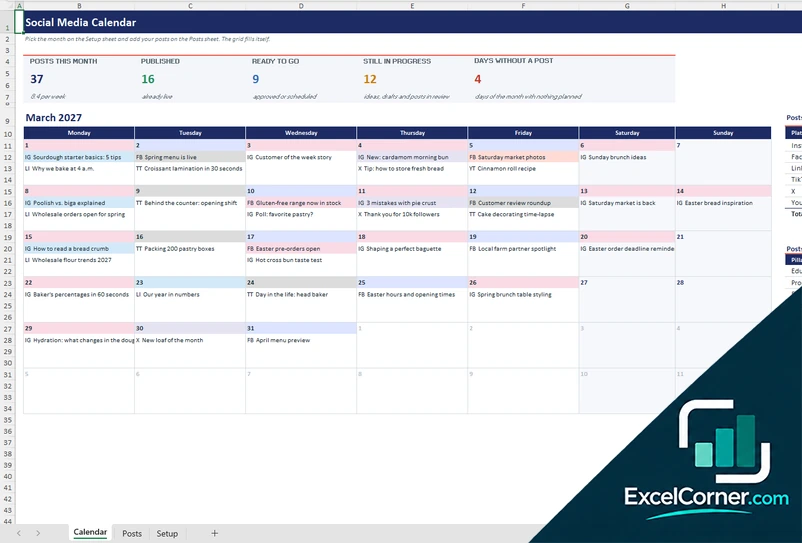
Yes. Replace the sample brand with your client’s name, enter the data and share the dashboard or print it as a PDF. For planning the posts before they go out, see the social media calendar templates.
Does the template work in Google Sheets?
The files are made for Microsoft Excel and use standard formulas with no macros. You can upload them to Google Drive and open them with Google Sheets, but some formatting or charts may look different.
Is my information stored online?
No. The templates are plain Excel files, so the posts, metrics and targets you type stay in your own file on your own computer.
More free marketing templates
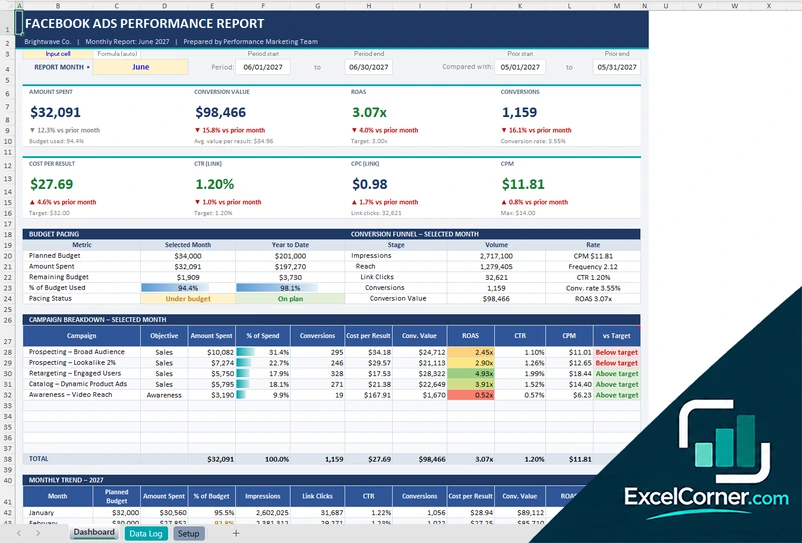
These templates are reporting tools with made-up sample data. The metrics, benchmarks and targets are examples and are not a guarantee of reach, engagement or revenue. Excel Corner is not affiliated with Instagram, Facebook, LinkedIn, TikTok, YouTube, Pinterest or X. Excel is a trademark of Microsoft Corporation; Excel Corner is not affiliated with Microsoft.