
Home › Marketing, Sales & Customers › Sales Pipeline Excel Template
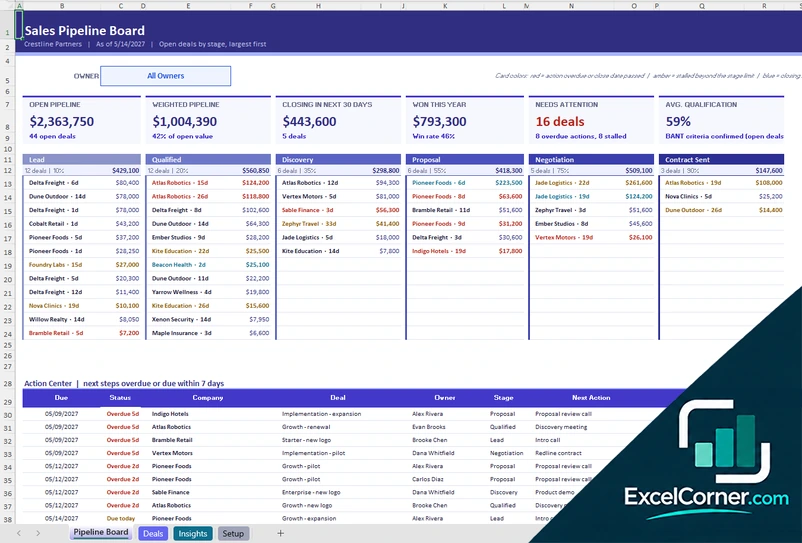
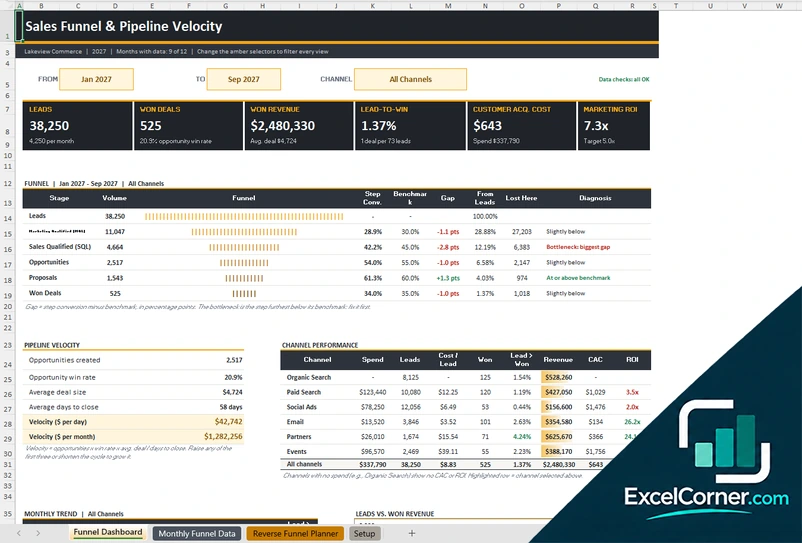
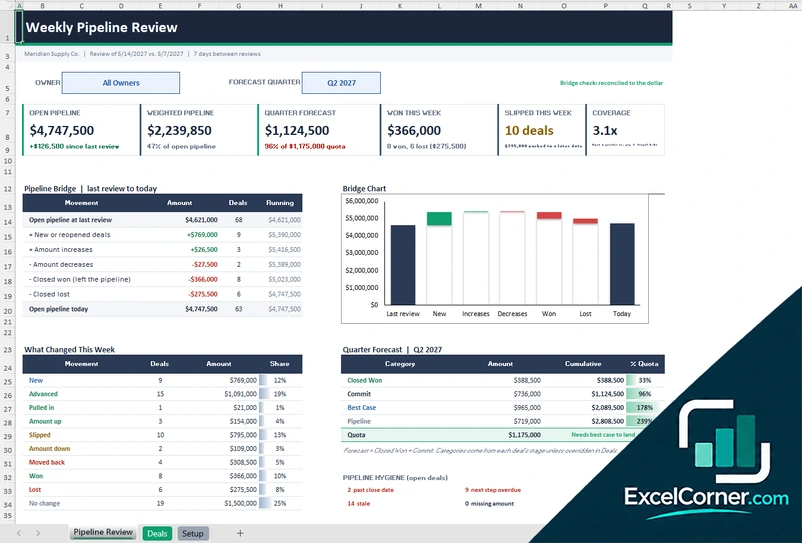
Previewing: Version 1 · Sales Pipeline Board. Pick another version on the right.
Instant download · No sign-up · No email
Download these free sales pipeline templates for Excel to see every deal, every stage and what will close. One version is a pipeline board with a column for each stage and an action center for next steps, one is a funnel dashboard that shows the conversion between stages and the velocity of your pipeline, and one is a weekly pipeline review that shows what moved since the last meeting.
Choose your version
- File
- .xlsx · 126 KB · 4 sheets
- Works with
- Microsoft Excel (.xlsx)
- Macros
- None · formulas only
- Price
- Free
Manage your sales pipeline in an Excel spreadsheet
A sales pipeline is the list of deals that you are working on, each in a stage between a first contact and a closed sale. Managing it well means knowing how much is in each stage, how likely each deal is to close, which deals are stuck and what the next step is. A spreadsheet is a simple way to start: it costs nothing, you can change the stages to fit the way you sell, and the whole team can see the same numbers.
These Excel templates look at the pipeline in three ways. The first is a deal-based pipeline board: you enter each deal once and a board shows the deals in a column for each stage, with the value, the owner, the next action and a health color, together with the weighted pipeline, the deals closing soon and a list of overdue actions. The second is a funnel and velocity dashboard that works on monthly numbers by channel: it shows how many leads become opportunities, proposals and won deals, where the funnel leaks, how fast the pipeline moves and which channel pays back. The third is a weekly pipeline review for sales meetings: it compares the pipeline today with the last review and shows what was won, what slipped, what moved forward and how well the forecast quarter is covered.
Best for
- Sales managers and sales reps who run a pipeline review every week
- Founders and small teams that do not have a CRM yet, or want a clear view outside it
- Marketing and revenue operations teams that measure the funnel from lead to won deal
Maybe not for
A CRM such as HubSpot, Salesforce or Pipedrive, which stores contacts, emails and activities and can build live pipeline reports. These templates are Excel files and they work well when you want a simple pipeline, a weekly review or a funnel analysis from an export.
Which version is right for you?
All three are free, formula-driven Excel files with sample data you can replace. They are independent, so you can download more than one.
Version 1
Sales Pipeline Board
Enter each deal once and get a board with a column for each stage, an owner filter, the weighted pipeline, an action center and insights on win rate and loss reasons.
Pipeline BoardDealsInsightsSetup
.xlsx · 126 KB
Version 2
Funnel and Velocity Dashboard
See how leads become won deals, compare each step with a benchmark, find the bottleneck, measure the velocity and the ROI of every channel, and plan the funnel you need to hit a target.
Funnel DashboardMonthly Funnel DataReverse Funnel PlannerSetup
.xlsx · 68 KB
Version 3
Weekly Pipeline Review
Update your deals once a week and get a pipeline bridge, the deals that slipped or advanced, the quarter forecast by category against quota and a hygiene check.
Pipeline ReviewDealsSetup
.xlsx · 139 KB
What is inside the sales pipeline Excel templates
Version 1: Sales Pipeline Board
The Pipeline Board shows your open deals in one column for each stage, from lead to contract sent, with the company, the value, the age in stage and a color for the health of the deal. An owner filter lets you see one owner or all of them, and six cards show the open pipeline, the weighted pipeline, the deals closing in the next 30 days, the deals won this year, the deals that need attention and the average qualification score. An action center below lists the next actions that are overdue or due within seven days. The Deals sheet holds up to 500 deals with the company, the deal name, the owner, the source, the billing model, the price and term, the stage, the dates, the next action and its due date, and a BANT qualification of budget, authority and timeline. It calculates the contract value, the win probability, the weighted value, the days in stage, the age of the deal and a qualification score. The Insights sheet shows the open deals, the win rate, the average won deal, the sales cycle and the velocity, the conversion between stages, why deals are lost, the performance by lead source and billing model, an owner scorecard and a chart of won versus open value by month. The Setup sheet holds the stages with their probability and the maximum days in each stage, and the lists.
Version 2: Funnel and Velocity Dashboard
The Funnel Dashboard lets you choose the period and the channel, and shows six cards: the leads, the won deals, the won revenue, the lead-to-win rate, the customer acquisition cost and the marketing ROI. A funnel table lists each stage with the volume, a bar, the conversion from the previous stage, the benchmark, the gap, the share lost at that step and a diagnosis, and it points out the step that is the bottleneck. Pipeline velocity shows the opportunities, the win rate, the average deal size and the days to close, and gives the value that the pipeline produces each day and each month. A channel performance table shows the spend, the leads, the cost per lead, the conversion to won, the revenue, the velocity and the return of each channel, and a chart compares the leads with the won revenue by month. The Monthly Funnel Data sheet holds up to 300 rows, one for each month and channel, with the spend, the leads, the opportunities, the proposals, the won deals, the won revenue and the days to close, and it calculates the conversion rates, the cost per lead, the average deal and a data check. The Reverse Funnel Planner starts from a revenue target and works backward to the leads and the budget you need, compares them with your actual results and shows what happens if one step improves. The Setup sheet holds the channels, the funnel stages and the benchmark conversion rates.
Version 3: Weekly Pipeline Review
The Pipeline Review is designed for the weekly sales meeting. You choose the owner and the forecast quarter, and six cards show the open pipeline, the weighted pipeline, the quarter forecast against the quota, what was won this week, what slipped this week and the coverage. A pipeline bridge, with a chart, takes you from the open pipeline at the last review to the open pipeline today: new deals, amounts that went up or down, deals won, deals lost and deals closed. A table of what changed this week groups the movements, and the quarter forecast shows the closed won, the commit, the best case and the pipeline, each with the cumulative amount and the percentage of the quota. Pipeline hygiene counts the deals with a past close date, no next step or no recent activity, and lists the deals that slipped and the deals that advanced or are new. The Deals sheet holds up to 500 deals with the account, the opportunity, the owner, the segment, the close date, the amount, the stage, the forecast category override, the last activity and the next step, plus a snapshot of the last review. It calculates the probability, the weighted value, the forecast category, the close quarter, the movement since the last review and the idle days. The Setup sheet holds the review calendar, the stages with their probability and forecast category, the owners with their quarterly quotas and the lists.
How to use a sales pipeline template in Excel
- Download
Pick the version you want and open it in Excel. The files have sample deals or funnel data for a made-up company, so you can see how each sheet works. - Set up your stages
On the setup sheet, enter your company name, your pipeline stages with their win probability, your owners and the other lists. - Add your deals or data
Enter one row for each deal on the deals sheet, or one row for each month and channel on the funnel data sheet. Yellow or blue cells are inputs. - Update every week
Change the stage, the amount, the close date and the next step of each deal. The board, the weighted pipeline and the charts update on their own. - Review the pipeline
Look at the weighted pipeline, the deals that are stuck or overdue, the conversion between stages and the coverage of your quota or target.
Replace the sample deals with your own. The probabilities, the weighted values, the flags and the charts update on their own.
Which sales pipeline template do you need?
| Sales Pipeline Board | Funnel and Velocity Dashboard | Weekly Pipeline Review | |
|---|---|---|---|
| For | Managing each deal by stage | Measuring the funnel and its conversion | Running the weekly sales meeting |
| Best for | Reps and small teams without a CRM | Marketing and sales operations | Sales managers and leaders |
| Data you enter | Up to 500 deals | Up to 300 rows by month and channel | Up to 500 deals plus the last review |
| Main outputs | Board by stage, weighted pipeline, win rate, loss reasons, owner scorecard | Funnel conversion, bottleneck, velocity, cost per lead, channel ROI, reverse funnel | Pipeline bridge, slipped and new deals, quarter forecast, coverage, hygiene |
| Sheets | 4 | 4 | 3 |
| Charts | Yes | Yes | Yes |
They are separate files, so you can use more than one.
Tips for managing a sales pipeline
- Define clear stages with entry rules, so that two reps would put the same deal in the same stage.
- Give each stage a win probability based on your own history, and review it every quarter.
- Record a next step and a date for every open deal, and look at the deals with no next step first.
- Watch the time in stage. A deal that sits much longer than average is at risk.
- Keep the close date honest. Move it when the buyer moves it, and track how often it slips.
- Look at the pipeline coverage, which is the open pipeline divided by the quota. Many teams aim for about three times the quota.
- Record why you lose deals, because the reasons show what to fix in the product, the price or the process.
Frequently asked questions
Are these sales pipeline templates for Excel free?
Yes. All three versions are free to download as .xlsx files. You do not need an account or an email address.
Which version should I choose?
Choose the Sales Pipeline Board (Version 1) to manage individual deals by stage with next steps and a deal list. Choose the Funnel and Velocity Dashboard (Version 2) to measure how leads become customers and which channels work best. Choose the Weekly Pipeline Review (Version 3) if you run a weekly pipeline meeting and want to see what changed and how the quarter looks.
What is a sales pipeline?
A sales pipeline is a view of all the deals that you are working on, grouped by the stage they are in, such as lead, qualified, proposal and negotiation. It shows how much potential revenue you have and where deals are waiting.
What is the weighted pipeline?
The weighted pipeline is the sum of each deal’s amount multiplied by the win probability of its stage. A deal of $10,000 in a stage with a 40% probability counts as $4,000. It gives a more realistic number than the total open amount.
What is the difference between a sales pipeline and a sales funnel?
A pipeline follows individual deals through stages, while a funnel counts how many leads or deals reach each stage and shows the conversion between stages. Version 1 and Version 3 are deal-based pipelines, and Version 2 is a funnel with velocity.
Can I change the pipeline stages?
Yes. Each template has a setup sheet where you enter your own stages and their probabilities. The board, the weighted amounts and the conversion tables use the stages that you enter.
Can I use these templates with my CRM data?
Yes. You can copy an export from your CRM into the deals or funnel data sheet, as long as the columns match. The templates do not connect to a CRM, so you paste the data yourself.
Does the template work in Google Sheets?
The files are made for Microsoft Excel and use standard formulas with no macros. You can upload them to Google Drive and open them with Google Sheets, but some formatting or charts may look different.
Is my information stored online?
No. The templates are plain Excel files, so the numbers, names and notes you type stay in your own file on your own computer.
More free sales and marketing templates
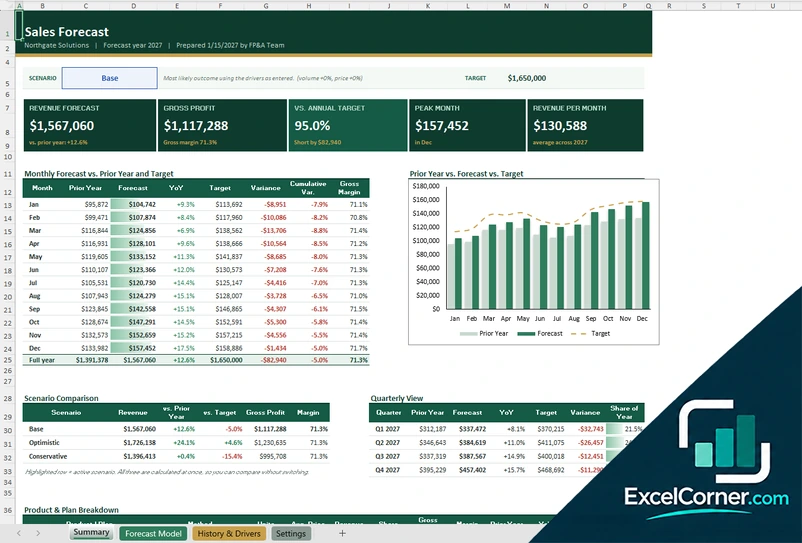
These templates are reporting and planning tools with made-up sample data. The figures, probabilities and forecasts depend on what you enter and are not a guarantee of future sales. Check them against your accounting and CRM records before you rely on them. Excel is a trademark of Microsoft Corporation; Excel Corner is not affiliated with Microsoft.