
Home › Marketing, Sales & Customers › Excel Sales Forecast Template
Previewing: Version 1 · Sales Forecast with Scenarios. Pick another version on the right.
Instant download · No sign-up · No email
Download these free sales forecast templates for Excel to plan revenue for the year. One version forecasts each product or plan from history, with seasonality and three scenarios. One builds the forecast from your open deals, with commit, best case and quota coverage. One is a rolling forecast that updates the outlook every month and bridges it back to the budget.
Choose your version
- File
- .xlsx · 54 KB · 4 sheets
- Works with
- Microsoft Excel (.xlsx)
- Macros
- None · formulas only
- Price
- Free
Forecast your sales in an Excel spreadsheet
A sales forecast is your estimate of the revenue you will make in a future period. It helps you set targets, plan hiring and inventory, decide on spending and spot a shortfall early. There is no single right way to forecast: you can project from past results and seasonality, you can add up the probability of each open deal, or you can take the actuals so far and re-forecast the rest of the year. Which one fits depends on how you sell and what data you have.
These Excel templates give you a version for each approach. The first is a forecast by product or plan: you set a method for each line, such as growth over last year or a trend with seasonality, choose a scenario, and the model returns the monthly revenue and gross profit against the prior year and the target. The second is a pipeline-based forecast for a sales team: every open deal has a stage, a probability and a forecast category, and the dashboard builds the forecast in layers, from closed won to commit and best case, against each rep’s quota. The third is a rolling forecast for finance: it combines the actuals to date with a forecast for the rest of the year, shows the outlook against the budget, tests a change in volume and price and tracks how accurate your past forecasts were.
Best for
- Founders, finance and FP&A teams that plan revenue for the year and compare it with a budget
- Sales leaders who forecast the quarter from the open pipeline and the quota of each rep
- Small business owners who forecast sales by product or plan from last year’s results
Maybe not for
A forecasting feature in your CRM or an FP&A planning platform that reads live data. These templates are Excel files: you enter your history, your deals or your budget, and the workbook does the forecast, the scenarios and the charts.
Which version is right for you?
All three are free, formula-driven Excel files with sample data you can replace. They are independent, so you can download more than one.
Version 1
Sales Forecast with Scenarios
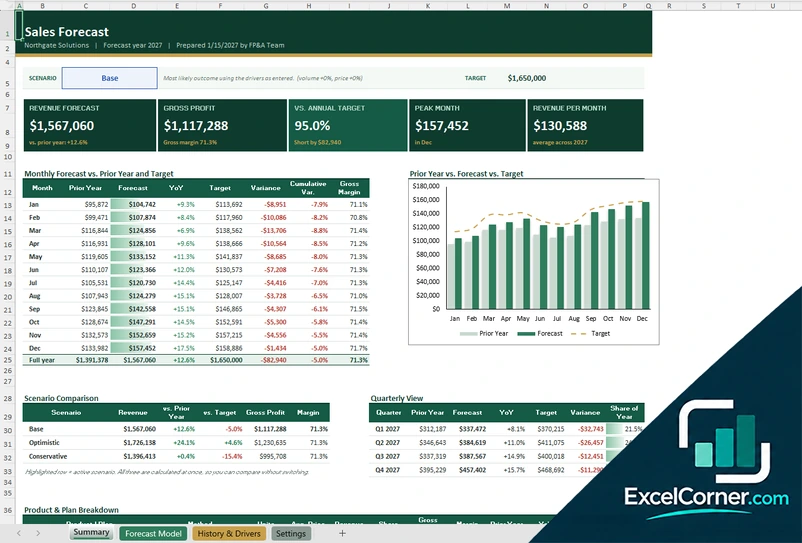
Enter two years of history and choose a method for each product. See the monthly forecast against the prior year and the target, three scenarios and a quarterly view.
SummaryForecast ModelHistory & DriversSettings
.xlsx · 54 KB
Version 2
Pipeline-Based Sales Forecast
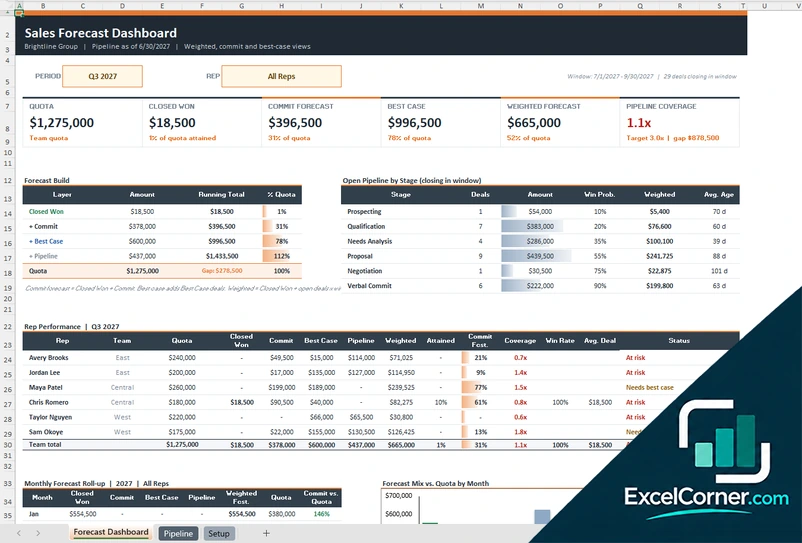
List your open deals with stage and amount and get the forecast for any period: closed won, commit, best case and weighted, plus coverage and rep performance against quota.
Forecast DashboardPipelineSetup
.xlsx · 98 KB
Version 3
Rolling Forecast and Budget Bridge
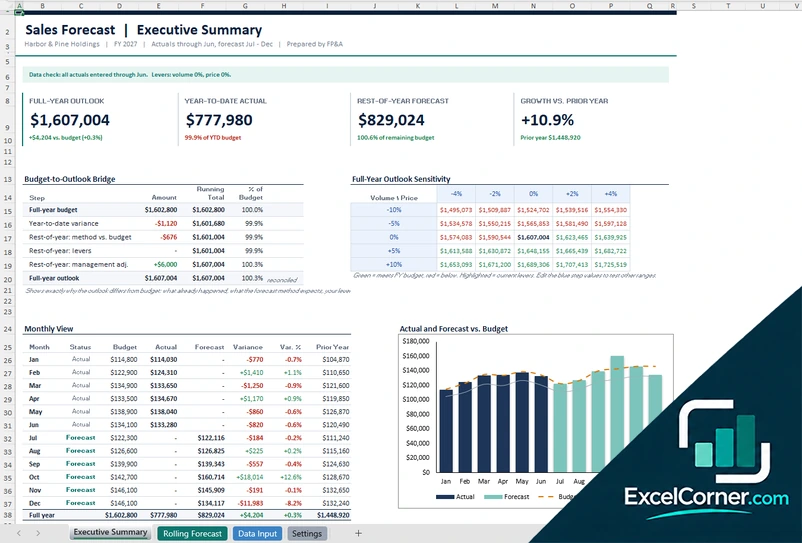
Enter the budget and the monthly actuals, pick a method for the rest of the year and see the outlook against the budget, a bridge, a sensitivity table and forecast accuracy.
Executive SummaryRolling ForecastData InputSettings
.xlsx · 51 KB
What is inside the sales forecast Excel templates
Version 1: Sales Forecast with Scenarios
The Summary sheet shows the forecast for the scenario you choose: the revenue forecast, the gross profit, the result against the annual target, the peak month and the average revenue per month. A monthly table compares the prior year, the forecast and the target with the variance, the cumulative variance and the gross margin, and a chart shows the three lines together. A scenario comparison lists the base, optimistic and conservative cases with the revenue, the change from the prior year and the target, the gross profit and the margin, a quarterly view gives the share of the year, and a product and plan breakdown shows the method, the units, the average price, the share and a trend signal for each line. The Forecast Model sheet calculates the units, the revenue and the gross profit by month for every product or plan. On the History & Drivers sheet you enter, for each product or plan, the forecast method (such as growth over last year, or a trend with seasonality), the growth, the average price and the price change, the cost of goods as a percentage of revenue and the monthly units of the last two years, and the sheet works out a seasonality index. The Settings sheet holds the company, the forecast year, the scenarios with their volume and price adjustments and the list of methods.
Version 2: Pipeline-Based Sales Forecast
The Forecast Dashboard lets you choose the period, such as a quarter, and the rep or team. Six cards show the quota, the closed won amount, the commit forecast, the best case, the weighted forecast and the pipeline coverage. A forecast build adds the layers one on top of the other, closed won, then commit, best case and pipeline, with the running total and the percentage of the quota, and the open pipeline closing in the period is shown by stage with the deals, the win probability, the weighted amount and the average age. A rep performance table lists, for each rep, the quota, the closed won amount, the commit, the best case, the pipeline, the weighted forecast, the amount attained, the coverage, the win rate, the average deal and a status. A monthly roll-up and a chart show the forecast mix against the quota by month. The Pipeline sheet holds up to 600 deals with the account, the opportunity, the product or plan, the lead source, the dates, the amount, the stage, a category and probability override, the last activity and the next step, and it calculates the win probability, the forecast category, the weighted amount, the close quarter, the age, the days idle and the health of each deal. The Setup sheet holds the forecast settings, the reporting periods, the sales stages with their probability and category, the lists and the quotas of each rep.
Version 3: Rolling Forecast and Budget Bridge
The Executive Summary shows the full-year outlook, the year-to-date actual, the forecast for the rest of the year and the growth over the prior year. A budget-to-outlook bridge explains the difference between the full-year budget and the outlook in steps, a sensitivity table tests the outlook for changes in volume and price, and a monthly view lists each month as actual or forecast against the budget and the prior year. A chart compares the actual and forecast revenue with the budget, a table shows the performance by revenue line with the year-to-date variance, the full-year outlook, the budget, the variance and the forecast accuracy, and a forecast accuracy table compares the prior forecast with the actual of each closed month, with the error and a rating. A short month-end routine tells you what to update. The Rolling Forecast sheet lists each revenue line with its basis, the year-to-date actual and budget, the rest of the year, the full-year outlook and variances. On the Data Input sheet you enter the revenue lines with an owner, a method and an optional growth rate, the prior-year actuals, the budget, the actuals, the prior-cycle forecast and any management adjustments. The Settings sheet holds the forecast calendar, the company, the volume and price levers, the status rules and the forecast methods: budget, budget trend, prior-year growth and run-rate.
How to use a sales forecast template in Excel
- Download
Pick the version you want and open it in Excel. The files have sample data for a made-up company, so you can see how each sheet works. - Set it up
On the settings or setup sheet, enter your company name, the forecast year, your products, plans or reps, and the targets, quotas or scenarios. - Enter your history or deals
Type the units sold in the last two years for each product, or list your open deals with their stage and amount, or enter the budget and the actuals by month. - Choose a method or scenario
Pick the forecast method for each line, or the scenario or period at the top of the dashboard. The forecast recalculates. - Compare and adjust
Check the forecast against the target, the quota or the budget, and change the assumptions until the plan is realistic.
Replace the sample data with your own. The forecast, the scenarios, the variances and the charts update on their own.
Which sales forecast template do you need?
| Sales Forecast with Scenarios | Pipeline-Based Sales Forecast | Rolling Forecast and Budget Bridge | |
|---|---|---|---|
| For | Forecasting each product or plan from history | Forecasting the quarter from open deals | Updating the outlook against the budget |
| Best for | Small businesses and product teams | Sales teams with a quota | Finance and FP&A |
| Data you enter | Two years of units, prices and drivers | Up to 600 open deals and rep quotas | Budget, actuals and prior year by revenue line |
| Main outputs | Monthly forecast vs. prior year and target, three scenarios, quarterly view | Commit, best case, weighted forecast, coverage, rep performance | Full-year outlook, budget bridge, sensitivity, forecast accuracy |
| Sheets | 4 | 3 | 4 |
| Charts | Yes | Yes | Yes |
They are separate files, so you can use more than one.
Tips for a better sales forecast
- Start from real data, such as last year’s sales by month, and write down every assumption you add on top.
- Forecast at the level where patterns are clear, such as by product or plan, and then add the lines up.
- Show a base, an optimistic and a conservative scenario, so that decisions do not depend on one number.
- Allow for seasonality. A month with usually twice the sales should not be forecast as an average month.
- Weight open deals by the probability of their stage, and use your own conversion history instead of generic percentages.
- Compare the forecast with what really happened every month and look at the error. It is the quickest way to improve.
- Keep the forecast simple enough that the team will update it.
Frequently asked questions
Are these sales forecast templates for Excel free?
Yes. All three versions are free to download as .xlsx files. You do not need an account or an email address.
Which version should I choose?
Choose the Sales Forecast with Scenarios (Version 1) to forecast revenue by product or plan from your history, with seasonality and optimistic and conservative scenarios. Choose the Pipeline-Based Sales Forecast (Version 2) to forecast the quarter from open deals against a quota. Choose the Rolling Forecast and Budget Bridge (Version 3) to combine actuals and forecast and compare the full-year outlook with the budget.
How do you forecast sales in Excel?
You can forecast from history, for example by applying a growth rate to last year’s sales by month, by fitting a trend with seasonality, or by taking the average of recent months. You can also forecast from the pipeline by adding each open deal multiplied by its probability. The templates use these methods, so you only enter your data.
What is the difference between a sales forecast and a sales budget?
A budget is a target that you set for the year, while a forecast is your best current estimate of what will happen. The forecast is updated when new results come in, and the difference between the two shows where you are ahead of or behind the plan.
What are commit, best case and weighted forecast?
These are forecast layers used by sales teams. Commit is the deals that the rep is confident to close, best case adds the deals that could close with some luck, and the weighted forecast adds the amount of every open deal multiplied by its win probability. Version 2 shows all of them against the quota.
Can I forecast monthly, quarterly or by year?
Yes. Version 1 forecasts by month and also shows a quarterly view, Version 2 lets you choose the reporting period, such as a quarter, and Version 3 forecasts the rest of the year month by month and shows the full-year outlook.
How accurate will the forecast be?
That depends on your data and your assumptions, because the templates calculate from what you enter. Version 3 includes a forecast accuracy table that compares each past forecast with the actual result, so you can see how reliable your forecast is and improve it.
Does the template work in Google Sheets?
The files are made for Microsoft Excel and use standard formulas with no macros. You can upload them to Google Drive and open them with Google Sheets, but some formatting or charts may look different.
Is my information stored online?
No. The templates are plain Excel files, so the numbers, names and notes you type stay in your own file on your own computer.
More free sales and marketing templates
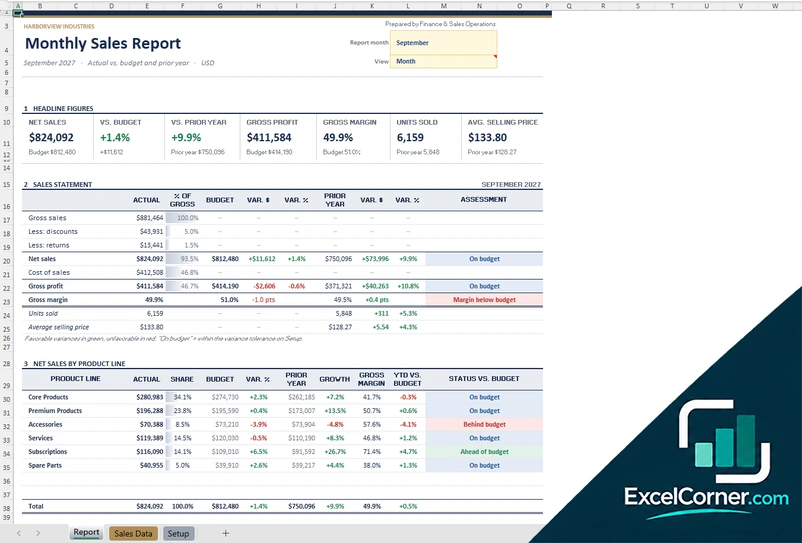
These templates are reporting and planning tools with made-up sample data. The figures, probabilities and forecasts depend on what you enter and are not a guarantee of future sales. Check them against your accounting and CRM records before you rely on them. Excel is a trademark of Microsoft Corporation; Excel Corner is not affiliated with Microsoft.