
Home › Marketing, Sales & Customers › Facebook Ads Report Template Excel
Previewing: Version 1 · Monthly Facebook Ads Report. Pick another version on the right.
Instant download · No sign-up · No email
Download these free Facebook ads report templates for Excel to turn the numbers from Ads Manager into a clear report. One version is a monthly report with budget pacing and a conversion funnel, one is a campaign scorecard that tells you which campaigns to scale or pause, and one is a performance report with date ranges, top creatives and a platform mix.
Choose your version
- File
- .xlsx · 128 KB · 3 sheets
- Works with
- Microsoft Excel (.xlsx)
- Macros
- None · formulas only
- Price
- Free
Report on your Facebook ads in an Excel spreadsheet
A Facebook ads report shows what your spend produced: how many people saw your ads, how many clicked, how many bought or signed up, what each result cost and what it returned. Ads Manager has all of this, but a report for a client or a boss needs a fixed layout, a comparison with the previous period and a view of the budget. A spreadsheet gives you that in a form you control and can share as a PDF.
These Excel templates give you three ways to report. The first is a monthly Facebook ads performance report: you log your campaigns in a data sheet, and the dashboard shows the spend, the conversion value, the ROAS, the cost per result, the click-through rate, the cost per click and the CPM against the previous month, with budget pacing, a conversion funnel, a campaign breakdown and a monthly trend. The second is a campaign scorecard for the people who manage the budget: it compares each campaign with its target, checks the pacing against the flight dates and gives a recommended action. The third is a report for clients with a choice of date ranges, a comparison with the previous period, a campaign table, the top creatives and the platform mix.
Best for
- Media buyers and marketing managers who report on Facebook and Instagram ads every month
- Agencies and freelancers that send a clean ads report to clients
- Small business owners who run their own ads and want to know what is working
Maybe not for
The reporting tools inside Meta Ads Manager or a reporting platform that connects to your account. These templates do not connect to Facebook: you export your data from Ads Manager and paste it into the data sheet, and the workbook builds the report.
Which version is right for you?
All three are free, formula-driven Excel files with sample data you can replace. They are independent, so you can download more than one.
Version 1
Monthly Facebook Ads Report
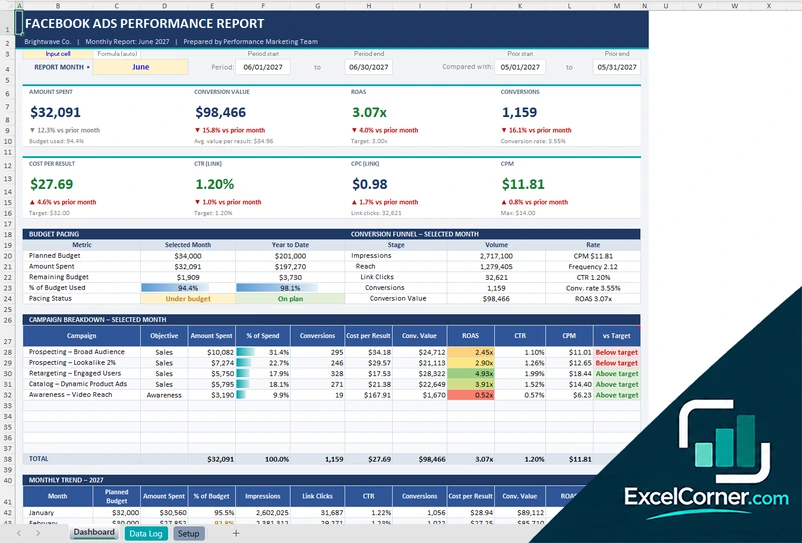
Choose the report month and see eight metrics against the prior month, the budget pacing, the conversion funnel, each campaign’s result and the monthly trend for the year.
DashboardData LogSetup
.xlsx · 128 KB
Version 2
Campaign Scorecard
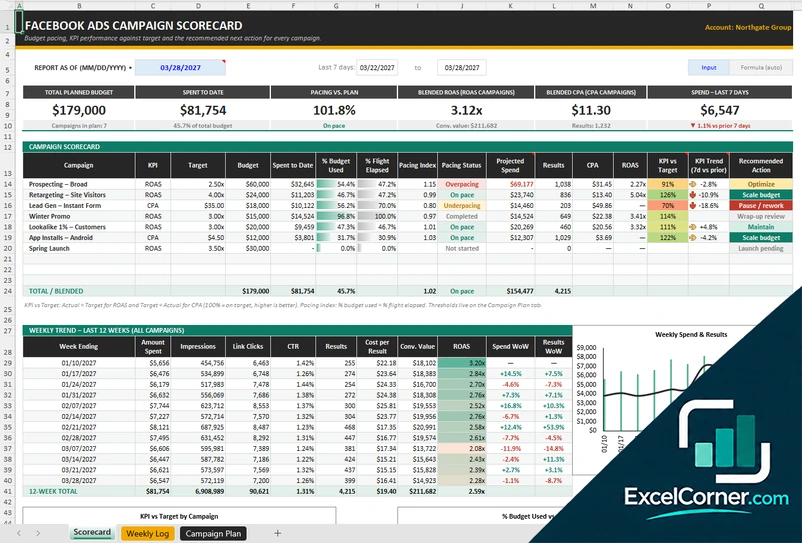
Enter the weekly results and a plan for each campaign and see the pacing, the KPI against the target, the projected spend and a recommended action for every campaign.
ScorecardWeekly LogCampaign Plan
.xlsx · 93 KB
Version 3
Facebook Ads Performance Report
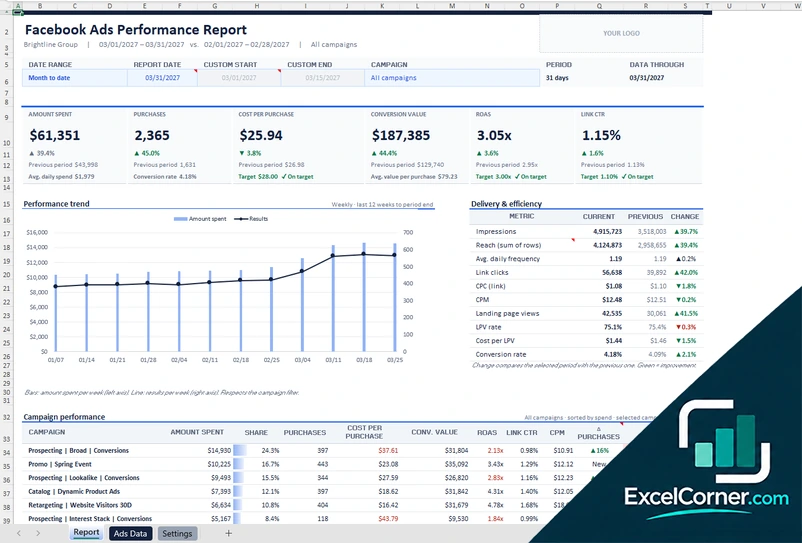
Choose a preset or custom date range and a campaign, and the report compares it with the previous period, with a trend chart, a campaign table, top creatives, platform mix and key insights.
ReportAds DataSettings
.xlsx · 525 KB
What is inside the Facebook ads report Excel templates
Version 1: Monthly Facebook Ads Report
The Dashboard has a report month selector and shows eight metrics with the change from the prior month: the amount spent, the conversion value, the ROAS, the conversions, the cost per result, the click-through rate, the cost per link click and the CPM. A budget pacing block compares the selected month and the year to date with the planned budget and shows whether you are under budget, on plan or over. The conversion funnel shows the impressions, the reach, the link clicks and the conversions with the rate between steps, and the campaign breakdown lists each campaign with its objective, the amount spent, the share of spend, the conversions, the cost per result, the conversion value, the ROAS, the CTR, the CPM and a status against its target. A monthly trend table and two charts follow the planned budget, the spend, the impressions, the clicks and the ROAS across the year. The Data Log holds up to 1,000 rows with the campaign, the objective, the amount spent, the impressions, the reach, the link clicks, the results and the conversion value, and it calculates the cost per result, the frequency and the other rates. The Setup sheet holds the report settings, the monthly budget plan, the campaign list, the dropdown lists and the performance targets.
Version 2: Campaign Scorecard
The Scorecard has a report date and shows six cards: the total planned budget, the spend to date, the pacing against the plan, the blended ROAS, the blended cost per acquisition and the spend of the last seven days. The campaign scorecard lists each campaign with its primary KPI, the target, the budget, the spend to date, the percentage of the budget used, the percentage of the flight elapsed, a pacing index and status, the projected spend, the results, the KPI against the target, the trend of the last seven days against the previous seven and a recommended action based on your decision rules. A weekly trend of the last 12 weeks follows the spend, the impressions, the clicks, the cost per result, the conversion value and the weekly change, and charts show the weekly spend and results and the KPI against the target. The Weekly Log holds up to 800 rows with the week ending date, the campaign, the ad set or audience, the creative, the amount spent, the impressions, the link clicks, the results and the conversion value, and it calculates the cost per result and a data check. The Campaign Plan sheet holds the account settings and decision rules, the dropdown lists and a flight plan with the primary KPI, the target, the dates, the budget, the number of days and the average daily budget of each campaign.
Version 3: Facebook Ads Performance Report
The Report sheet has selectors for the date range, with presets such as month to date and a custom start and end, the campaign and the report date, and it shows the data through the date you choose. Six cards show the amount spent, the purchases, the cost per purchase, the conversion value, the ROAS and the link CTR, with the change from the previous period. A performance trend chart follows the spend and the results by week, and a delivery and efficiency table compares the current and the previous period for the impressions, the reach, the frequency, the link clicks, the CPC, the CPM, the landing page views, the landing page view rate, the cost per landing page view and the conversion rate. A campaign performance table gives the spend, the share, the purchases, the cost per purchase, the conversion value, the ROAS, the CTR and a status. Top creatives can be ranked by the measure you choose, and there is a platform mix, a list of key insights and a box for analyst notes and next steps. The Ads Data sheet holds up to 5,000 rows with the campaign, the ad set, the ad, the platform, the amount spent, the impressions, the reach, the link clicks, the landing page views, the results and the conversion value. The Settings sheet holds the report details, the monthly budget, the platforms and the KPI targets.
How to use a Facebook ads report template in Excel
- Download
Pick the version you want and open it in Excel. The files have sample campaigns for a made-up brand, so you can see how each sheet works. - Set it up
On the setup or settings sheet, enter the account name, your monthly budget, your campaigns and your targets, such as the ROAS or the cost per result. - Export from Ads Manager
In Ads Manager, export your results by campaign, ad set or ad, for the period you want, as a CSV or Excel file. - Paste into the data sheet
Copy the columns, such as amount spent, impressions, reach, link clicks, results and conversion value, into the data sheet. The calculated columns fill in on their own. - Read the report
Choose the month or the date range on the report. Check the pacing, the cost per result and the ROAS, and decide where to put your budget next.
Replace the sample data with your own. The metrics, the comparisons, the status and the charts update on their own.
Which Facebook ads report template do you need?
| Monthly Facebook Ads Report | Campaign Scorecard | Facebook Ads Performance Report | |
|---|---|---|---|
| For | A monthly report with budget pacing | Managing campaigns against targets | A client report for any date range |
| Best for | Monthly reports and budget control | Media buyers who optimize every week | Agencies and client reporting |
| Data you enter | Up to 1,000 rows by campaign | Up to 800 weekly rows and a campaign plan | Up to 5,000 ad rows |
| Main outputs | Spend, ROAS, cost per result, CTR, CPC, CPM, pacing, funnel, trend | Pacing, KPI vs. target, projected spend, recommended action, 12-week trend | KPIs vs. previous period, trend, top creatives, platform mix, insights |
| Sheets | 3 | 3 | 3 |
| Charts | Yes | Yes | Yes |
They are separate files, so you can use more than one.
Tips for Facebook ads reporting
- Choose the main result for each campaign, such as purchases or leads, and report the cost of that result first.
- Compare each period with the previous one, because the change tells you more than the number.
- Check the budget pacing every week, so that you do not find out at the end of the month that you overspent or underspent.
- Look at the ad level, not only the campaign, to see which creatives and audiences deliver.
- Watch the frequency. When the same people see your ad too often, the cost of a result usually goes up.
- Use the same attribution window and the same date range when you compare results.
- Write down what you will test next, so that the report leads to a decision.
Frequently asked questions
Are these Facebook ads report templates for Excel free?
Yes. All three versions are free to download as .xlsx files. You do not need an account or an email address.
Which version should I choose?
Choose the Monthly Facebook Ads Report (Version 1) for a monthly report with budget pacing, a funnel and a campaign breakdown. Choose the Campaign Scorecard (Version 2) to manage campaigns against targets and see a recommended action for each one. Choose the Facebook Ads Performance Report (Version 3) for a client report where you pick the date range and see the top creatives and the platform mix.
What should a Facebook ads report include?
At least the amount spent, the impressions or reach, the link clicks, the results and their cost, the conversion value and the return on ad spend, compared with the previous period. A good report also shows which campaigns and ads performed best and how the spend compares with the budget. These templates include all of that.
Can I import data from Facebook Ads Manager?
Yes, by exporting. In Ads Manager you can export a report as a CSV or Excel file, and you can copy the columns into the data sheet of the template. The templates do not connect to your account.
Do the templates work for Instagram ads?
Yes. Ads that run on Meta platforms are exported together, and Version 3 includes a platform column, so you can see Facebook and Instagram placements side by side.
What is ROAS and how is it calculated?
ROAS, or return on ad spend, is the conversion value divided by the amount spent. A ROAS of 3.0 means that each dollar of ads produced three dollars of conversion value. The templates calculate it for each campaign and for the total.
What is budget pacing?
Budget pacing compares how much of your budget you have spent with how much of the period has passed. If you have spent 60% of the budget after 40% of the month, you are overpacing. Versions 1 and 2 show the pacing and flag it as under budget, on plan or over.
Does the template work in Google Sheets?
The files are made for Microsoft Excel and use standard formulas with no macros. You can upload them to Google Drive and open them with Google Sheets, but some formatting or charts may look different.
Is my information stored online?
No. The templates are plain Excel files, so the numbers, names and notes you type stay in your own file on your own computer.
More free marketing templates
These templates are reporting tools with made-up sample data. The metrics, benchmarks and targets are examples and are not a guarantee of results. Excel Corner is not affiliated with Meta, Facebook, Google or any other platform. Excel is a trademark of Microsoft Corporation; Excel Corner is not affiliated with Microsoft.