
Home › Operations, Inventory & Logistics › Value Stream Mapping Template Excel
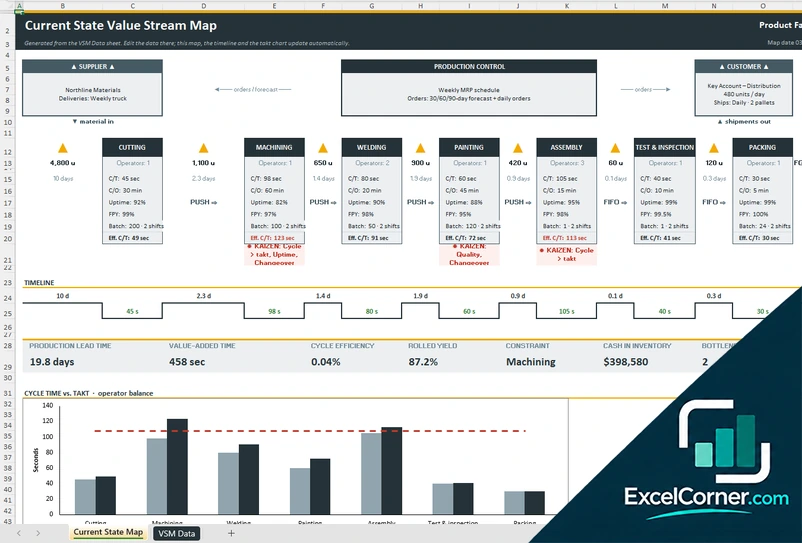
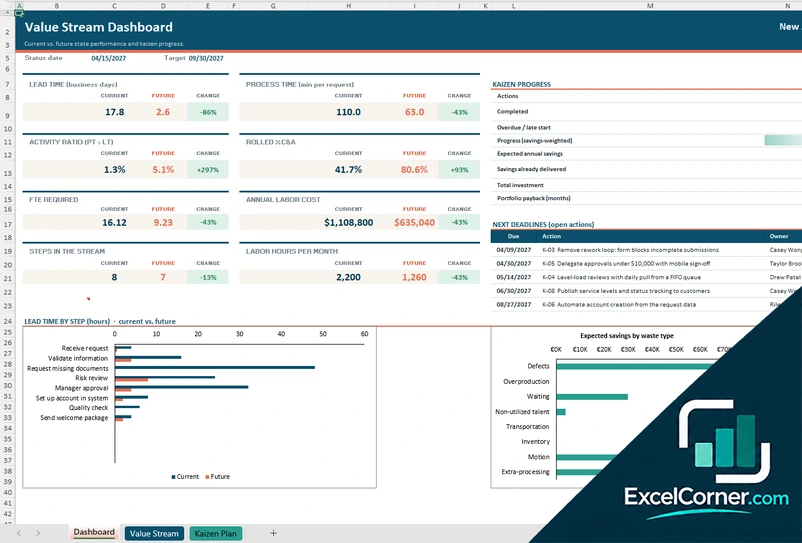
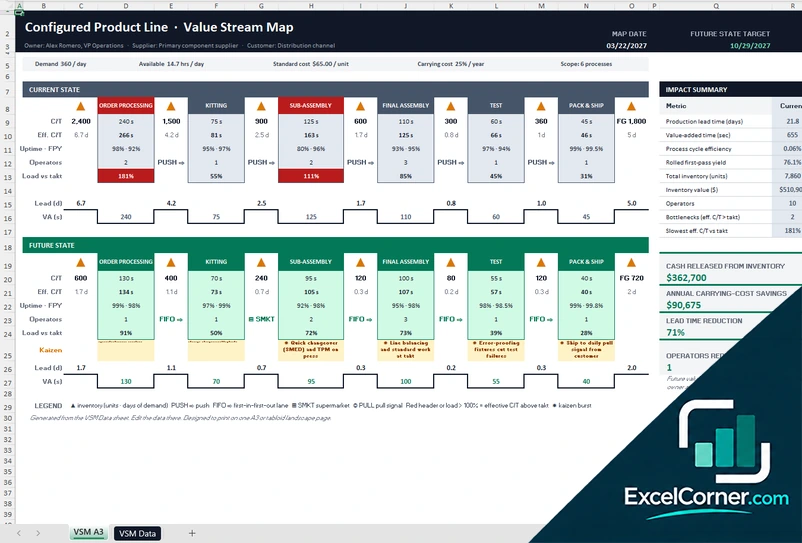
Previewing: Version 1 · Current State Map. Pick another version on the right.
Instant download · No sign-up · No email
Download these free value stream mapping templates for Excel to see where time is lost between a customer order and delivery. One version draws a current state map for a production line, one is a value stream dashboard for office and service processes with a kaizen plan, and one is a one-page A3 that compares the current state with the future state and shows the cash released.
Choose your version
- File
- .xlsx · 25 KB · 2 sheets
- Works with
- Microsoft Excel (.xlsx)
- Macros
- None · formulas only
- Price
- Free
Map a value stream in an Excel spreadsheet
Value stream mapping is a lean method that follows a product or a service from the supplier to the customer and records every step, with its cycle time, its changeover time, its inventory and the waiting between steps. The map shows how much of the total lead time is real work and how much is waiting, and so it points to the waste that is worth removing first. It is usually drawn with sticky notes or on a large sheet, but the numbers behind it (the cycle time, the takt time, the uptime, the yield) are easy to enter in a spreadsheet, which then does the arithmetic and draws the map.
These Excel templates give you three ways to use the method. The first is a current state map for a production line: you enter the customer demand, the suppliers and the data of up to seven processes, and the sheet draws the map with the inventory triangles and the timeline, and calculates the production lead time, the value-added time, the process cycle efficiency, the rolled throughput yield and the constraint. The second is a value stream dashboard for an office or a service process, with the activity ratio, the full-time equivalents, the annual labor cost, a current and a future state and a kaizen plan that ranks the improvements by impact and effort. The third is a one-page A3 report that puts the current state and the future state side by side, with the kaizen bursts, the takt time and the impact: the lead time reduction, the inventory cash released, the carrying cost saved and the operators redeployed.
Best for
- Lean, continuous improvement and operations teams in manufacturing
- Managers of service, office and healthcare processes that want to cut waiting time
- Students, consultants and Six Sigma practitioners who learn or teach lean tools
Maybe not for
A dedicated lean software or a large wall map made together with the team. These templates are Excel files: they do the calculations and draw the map, and you can use them for the first draft or to keep the data of a map that you drew on paper.
Which version is right for you?
All three are free, formula-driven Excel files with sample data you can replace. They are independent, so you can download more than one.
Version 1
Current State Map
Enter the demand and the data of up to seven processes and the workbook draws the current state value stream map with a timeline, and calculates lead time, cycle efficiency, yield and the constraint.
Current State MapVSM Data
.xlsx · 25 KB
Version 2
Value Stream Dashboard
A value stream dashboard for office and service processes with a current and a future state, an automate, improve or eliminate action for every step and a kaizen plan with impact, effort, savings and payback.
DashboardValue StreamKaizen Plan
.xlsx · 32 KB
Version 3
Current vs. Future State A3
A one-page A3 with the current state and the future state maps, the kaizen bursts, the takt time and an impact summary with the lead time reduction, the inventory cash released and the operators redeployed.
VSM A3VSM Data
.xlsx · 21 KB
What is inside the value stream mapping Excel templates
Version 1: Current State Map
The Current State Map sheet draws the value stream from the supplier on the left to the customer on the right, with a production control box, the process boxes with their data, the inventory between them and a timeline of the waiting and the processing time at the bottom. Measures show the production lead time, the value-added time, the process cycle efficiency, the rolled throughput yield, the constraint, the cash that is tied up in inventory and the bottlenecks, and a chart compares the cycle time of each process with the takt time. On the VSM Data sheet you enter the customer, the demand, the available working time, the suppliers, and for each of up to seven processes the name, the cycle time, the changeover time, the uptime, the yield, the number of operators and the inventory before it.
Version 2: Value Stream Dashboard
The Dashboard sheet shows the lead time, the process time, the activity ratio, the rolled percent complete and accurate, the full-time equivalents, the annual labor cost, the progress of the kaizen actions and the next deadlines, with two charts. On the Value Stream sheet you list the steps of the process with the current and the future time, the wait, the percent complete and accurate, the people, and an action for each step: automate, improve or eliminate. The Kaizen Plan is a register of the improvements with the impact, the effort, a priority, the owner, the deadline, the status, the savings and the payback.
Version 3: Current vs. Future State A3
The A3 sheet has the current state map above and the future state map below, drawn from the same data, with the takt time, the kaizen bursts that mark the improvements and an impact summary: the lead time reduction, the cash released from inventory, the savings in carrying cost and the operators who can be redeployed. On the VSM Data sheet you enter the customer demand and the data of up to six processes, with the current and the future cycle time, changeover, inventory and operators.
How to use a value stream mapping template in Excel
- Download
Pick the version you want and open it in Excel. The files have a sample value stream, so you can see how each sheet works. - Define the value stream
Enter the product family or the service, the customer demand, the working time and the suppliers, and work out the takt time. - Enter the process data
For each process enter the cycle time, the changeover time, the uptime, the yield, the number of operators and the inventory before it. - Read the map and the timeline
Look at the production lead time, the value-added time, the process cycle efficiency and the constraint. Compare the cycle times with the takt time. - Plan the improvements
List the kaizen actions, estimate their impact, and build the future state map to see the lead time and the cash that you can release.
Replace the sample data with your own. The map, the timeline, the measures and the charts update on their own.
Which value stream mapping template do you need?
| Current State Map | Value Stream Dashboard | Current vs. Future State A3 | |
|---|---|---|---|
| For | A production line from supplier to customer | Office, service and healthcare processes | A one-page report for the improvement team |
| Best for | Manufacturing and lean teams | Service and administrative teams | Managers and kaizen workshops |
| Data you enter | Up to 7 processes | Steps with current and future times | Up to 6 processes |
| Main outputs | Lead time, value-added time, cycle efficiency, yield, constraint, inventory cash | Lead time, activity ratio, FTE, annual labor cost, kaizen plan | Current and future map, kaizen bursts, takt time, cash released, savings |
| Sheets | 2 | 3 | 2 |
| Charts | Yes | Yes | No |
They are separate files, so you can use more than one.
Tips for a good value stream map
- Map one product family or one service at a time, so that the map stays readable.
- Walk the process yourself and write down what you see. Do not rely on the procedures alone.
- Start with the customer. Work out the takt time from the demand and the available time.
- Measure the waiting between steps. Inventory and queues are usually most of the lead time.
- Compare each cycle time with the takt time to find the constraint.
- Draw the future state before you launch actions, and mark each improvement with a kaizen burst.
- Review the map after each improvement cycle and keep the old versions to show progress.
Frequently asked questions
Are these value stream mapping templates for Excel free?
Yes. All three versions are free to download as .xlsx files. You do not need an account or an email address.
Which version should I choose?
Choose the Current State Map (Version 1) to map a production line with its processes, inventory and timeline. Choose the Value Stream Dashboard (Version 2) for an office or service process with a kaizen plan. Choose the Current vs. Future State A3 (Version 3) for a one-page report that compares the two states and shows the savings.
What is value stream mapping?
Value stream mapping is a lean tool that shows the flow of material and information from the supplier to the customer. It records the time that each step takes and the time that the product waits, so that you can see the waste and decide what to improve.
What is takt time?
Takt time is the pace of production that matches the customer demand. You work it out by dividing the available working time by the demand in the same period. If a process takes longer than the takt time, it cannot meet the demand and it is a constraint.
What is process cycle efficiency?
Process cycle efficiency is the value-added time divided by the total lead time. A low figure means that the product spends most of its time waiting. Version 1 calculates it, and Version 2 shows a similar activity ratio.
Can I use value stream mapping for a service or an office process?
Yes. The method works for any process that has steps, waiting and a customer. Version 2 is made for office and service work and measures the time in hours or days instead of seconds.
What is a kaizen burst?
A kaizen burst is a mark on a value stream map that shows where an improvement is needed or planned. Version 3 shows the bursts on the future state map, and Version 2 lists the improvements in a kaizen plan with their impact and effort.
Does the template work in Google Sheets?
The files are made for Microsoft Excel and use standard formulas with no macros. You can upload them to Google Drive and open them with Google Sheets, but some formatting or charts may look different.
Is my information stored online?
No. The templates are plain Excel files, so the names, addresses, dates and amounts you type stay in your own file on your own computer.
These templates are documentation tools with made-up sample content. Review every SOP with the people who do the work and with your quality, safety and legal teams before you rely on it. Excel is a trademark of Microsoft Corporation; Excel Corner is not affiliated with Microsoft.