
Home › Operations, Inventory & Logistics › Process Flow Chart Template Excel
Previewing: Version 1 · Process Flow Builder. Pick another version on the right.
Instant download · No sign-up · No email
Download these free Excel process flow templates, also known as process flow chart templates, to map a process and find where time and money are lost. One version builds a swimlane flowchart from a list of steps, one compares the present and the proposed method with the classic operation, transport, inspection, delay and storage symbols, and one is a one-page SIPOC process map with a time ladder.
Choose your version
- File
- .xlsx · 26 KB · 2 sheets
- Works with
- Microsoft Excel (.xlsx)
- Macros
- None · formulas only
- Price
- Free
Excel process flow template: draw and analyze a process flow chart in a spreadsheet
A process flow chart, also called a process flow diagram or a process flowchart, shows the steps of a process in order, who does each step, where decisions are made and where work is handed from one person or team to another. It is the first tool you reach for when you want to understand a process, explain it to a new colleague or improve it. Drawing the chart by hand in a shape tool is slow, and the chart is separate from the numbers. A spreadsheet can do both: you list the steps once with their times and owners, and the chart and the measures follow.
These Excel templates give you three ways to work with a process flow. The first is a flowchart builder: you list each step with its shape, its swimlane, its touch time and its wait time, and the sheet draws a swimlane flowchart and calculates the lead time, the flow efficiency and the cost of each run. The second is a flow process chart in the style of industrial engineering: you chart the present method and a proposed method with the standard symbols, and the workbook shows the time, the distance and the cost that you save. The third is a one-page process map with a SIPOC header (suppliers, inputs, process, outputs and customers), the steps by phase and owner, the pain points and a time ladder that shows where the lead time goes.
Best for
- Operations and process improvement teams that document and improve processes
- Managers, analysts and consultants who need a flowchart together with time and cost figures
- Students and engineers who learn or teach process analysis and work study
Maybe not for
A diagramming tool such as Visio or a whiteboard app for free-form diagrams. These templates are Excel files that draw the flowchart from a table, so that the chart and the numbers always agree.
Which version is right for you?
All three are free, formula-driven Excel files with sample data you can replace. They are independent, so you can download more than one.
Version 1
Process Flow Builder
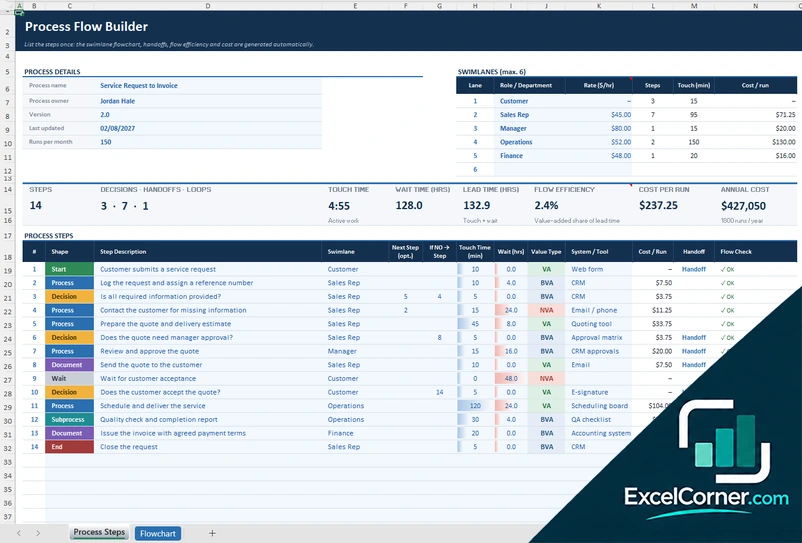
Enter each step with its shape, swimlane, times and value type and the workbook draws a swimlane flowchart and calculates the lead time, the flow efficiency, the cost per run and the annual cost.
Process StepsFlowchart
.xlsx · 26 KB
Version 2
Present vs. Proposed Method
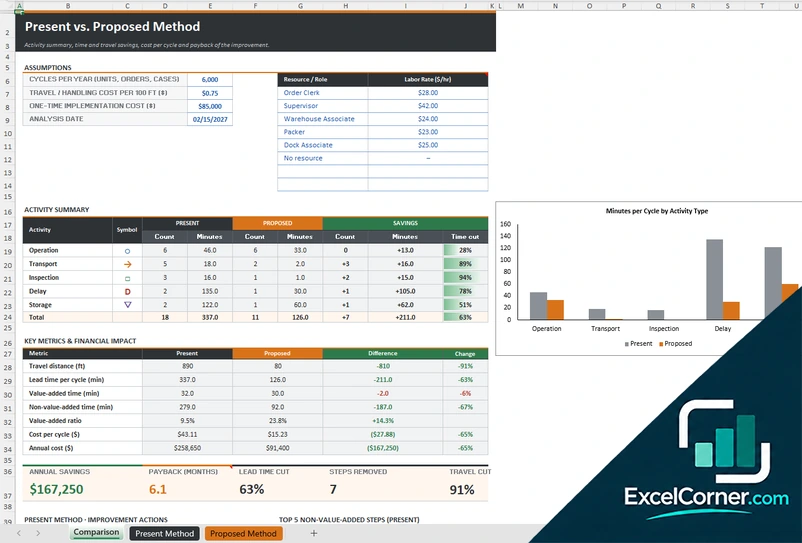
A flow process chart for the present and the proposed method, with a comparison of activities, minutes, travel distance, value-added ratio, cost per cycle, annual savings and payback.
ComparisonPresent MethodProposed Method
.xlsx · 31 KB
Version 3
SIPOC Process Map
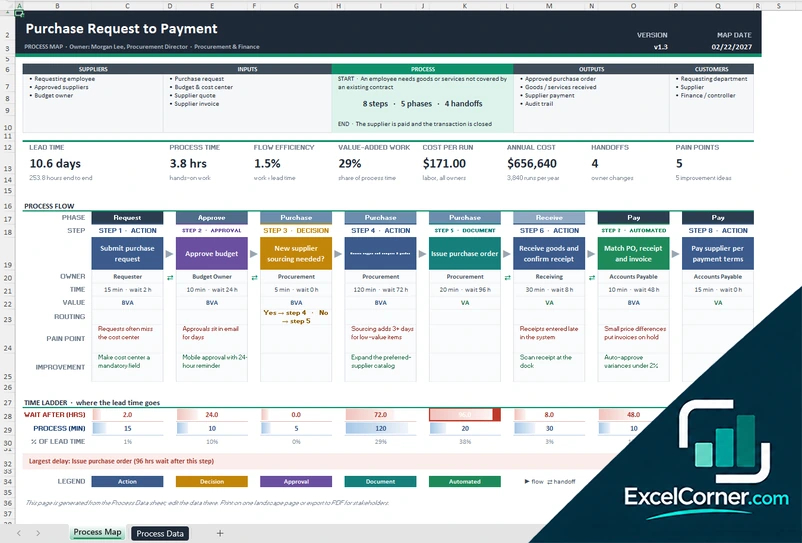
Fill in a data sheet and get a one-page process map with a SIPOC header, up to eight steps by phase and owner, pain points, improvement ideas and a time ladder of where the lead time goes.
Process MapProcess Data
.xlsx · 22 KB
What is inside the process flow chart Excel templates
Version 1: Process Flow Builder
On the Process Steps sheet you enter the name of the process, the owner, the version, the date of the last update and the runs per month, and you define up to six swimlanes, such as roles or departments, with an hourly rate. Eight measures are calculated: the number of steps, the decisions, handoffs and loops, the touch time, the wait time in hours, the lead time, the flow efficiency, the cost per run and the annual cost. The step table has one row for each step with the shape (start, process, decision, document, subprocess, wait or end), the description, the swimlane, the next step if it is not the following one, the step to go to when the answer to a decision is no, the touch time in minutes, the wait in hours, the value type (value-added, business value-added or non-value-added), the system or tool, the cost per run, a handoff flag and a flow check. The Flowchart sheet draws the swimlane flowchart from those rows, with a legend of the shapes, and has an option to highlight the steps that do not add value.
Version 2: Present vs. Proposed Method
The workbook has two flow process charts and a comparison. On the Present Method and the Proposed Method sheets you give the chart number, the subject charted, the chart type (material, person or form), the location, who charted it and where the process starts and ends. You then list each activity with its description, its type (operation, transport, inspection, delay or storage), the distance in feet, the time in minutes, whether it adds value, the resource or role that does it and the cost for each cycle, plus an improvement action in the present method and the change from the present method in the proposed one, and each sheet counts the activities and the minutes by type. The Comparison sheet takes the assumptions (cycles per year, the travel and handling cost per 100 feet, the one-time implementation cost, the analysis date and the labor rates by role) and shows an activity summary of the present and the proposed method with the savings by symbol, key metrics such as the travel distance, the lead time, the value-added time and ratio, the cost per cycle and the annual cost, and the annual savings, the payback in months, the lead time cut and the steps removed, with a chart of the minutes per cycle by activity type.
Version 3: SIPOC Process Map
The Process Map sheet is a one-page map that is generated from the Process Data sheet. At the top it shows the SIPOC of the process: the suppliers, the inputs, the process with its start and end, the outputs and the customers, and the version and the map date. Eight measures follow: the lead time, the process time, the flow efficiency, the share of value-added work, the cost per run, the annual cost, the handoffs and the pain points. The process flow shows each step as a block in its phase, with the owner, the time, the value type, the routing for decisions, the pain point and the improvement idea, and a time ladder shows the wait after each step in hours, the process time in minutes and the share of the lead time, and points out the largest delay. A legend explains the colors for action, decision, approval, document and automated steps. On the Process Data sheet you enter the process name, the trigger and the end point of the process, the owner and the scope, the SIPOC lists, the version, the map date and the runs per month, the phases, the owners and their hourly rates, and up to eight steps with the phase, the step, the owner, the process time, the wait after, the value type, the step to go to for a decision, the pain point, the improvement idea and the cost per run.
How to use a process flow chart template in Excel
- Download
Pick the version you want and open it in Excel. The files have a sample process, so you can see how each sheet works. - Describe the process
Enter the name of the process, the owner, the version and how often it runs, and list the roles or departments that take part, with their hourly rates. - List the steps
Add one row for each step with its description, its owner, its time and the step that comes next. For a decision, enter the step to go to when the answer is no. - Read the chart and the measures
Open the flowchart or the process map. The sheet draws the flow and shows the steps, the handoffs, the lead time, the flow efficiency and the cost. - Improve and compare
Mark the steps that add no value, redesign the process and compare the new version with the present one.
Replace the sample process with your own. The chart, the times, the costs and the flags update on their own.
Which process flow chart template do you need?
| Process Flow Builder | Present vs. Proposed Method | SIPOC Process Map | |
|---|---|---|---|
| For | A swimlane flowchart with time and cost | Comparing two methods with work study symbols | A one-page map for a high-level process |
| Best for | Process owners and improvement teams | Industrial engineers and lean practitioners | Managers and workshops |
| Main outputs | Flowchart, touch and wait time, lead time, flow efficiency, cost per run | Activity summary, time and distance saved, annual savings, payback | SIPOC, flow by phase, time ladder, pain points, cost per run |
| Sheets | 2 | 3 | 2 |
| Charts | Flowchart | Yes | Map |
They are separate files, so you can use more than one.
How to make a process flow chart in Excel by hand
You can also draw a process flow chart in Excel without a template. There are three common ways, and each one has limits.
Shapes: on the Insert tab, choose Shapes and use an oval for the start and the end, a rectangle for each step and a diamond for each decision. Join them with arrow connectors, which stay attached when you move a shape. Turn off the gridlines and set the page to landscape if the flow runs from left to right.
SmartArt: choose Insert, SmartArt, Process and pick a layout such as Basic Process or Vertical Chevron List, then type the steps in the text pane. It is quick, but it handles decisions, loops and swimlanes poorly.
Visio Data Visualizer: this add-in turns a table of steps into a diagram. It needs the add-in and a compatible Microsoft 365 account, so it is not available to everyone.
The templates on this page work the other way round. You list the steps in a table and the workbook draws the flow chart, so you do not move shapes by hand and the chart always agrees with the times and the costs in the table.
Tips for a useful process flow chart
- Decide where the process starts and where it ends before you draw anything.
- Map what really happens today, not what the procedure says should happen.
- Use one shape for each kind of step, such as a process, a decision or a document, so that the chart is easy to read.
- Show who does each step, so that handoffs and waiting between people become visible.
- Record the touch time and the wait time separately. Waiting is often most of the lead time.
- Mark the steps that add value for the customer, and look at the others for waste.
- Keep the chart at one page. Break a big process into subprocesses.
Frequently asked questions
Is there an Excel process flow template that I can download for free?
Yes. The three workbooks on this page are free .xlsx downloads: a flowchart builder with swimlanes, a present vs. proposed method chart and a SIPOC process map. You do not need an account or an email address.
What is the difference between a process flow and a flowchart?
In everyday use the two terms mean the same thing: a diagram of the steps of a process. A flowchart is usually a diagram with shapes and arrows. A process flow chart, a process flow diagram or a process map adds who does each step, the time that it takes and where the work waits.
How do I make a process flow chart in Excel?
You can draw one with the Shapes tool or with SmartArt on the Insert tab, or you can start from a template. With the templates on this page you list the steps in a table, with the owner, the shape and the times, and the sheet draws the chart for you.
Does Excel have a built-in process flow template?
Excel gives you shapes, SmartArt and the Visio Data Visualizer add-in to draw a flow, but it does not include a ready-made workbook that draws the flowchart from your steps and calculates the lead time and the cost. That is what the templates on this page do.
Which version should I choose?
Choose the Process Flow Builder (Version 1) to draw a swimlane flowchart from a list of steps and measure its time and cost. Choose the Present vs. Proposed Method (Version 2) to compare two methods with the standard flow process chart symbols. Choose the SIPOC Process Map (Version 3) for a one-page map of a high-level process with a time ladder.
What is a process flow chart?
A process flow chart is a diagram that shows the steps of a process in sequence, using symbols for actions, decisions, documents and other elements, and arrows for the direction of the flow.
What does flow efficiency mean?
Flow efficiency is the share of the total lead time in which someone is actually working on the item. If a request takes 100 hours from start to finish and 2.5 hours of that is work, the flow efficiency is 2.5%. Versions 1 and 3 calculate it.
What is a swimlane flowchart?
A swimlane flowchart arranges the steps in lanes, one for each person, role or department, so that you can see who is responsible for each step and where the work is passed on. Version 1 draws it for you.
What do the operation, transport, inspection, delay and storage symbols mean?
They are the classic symbols of a flow process chart. A circle is an operation that changes the item, an arrow is a transport or movement, a square is an inspection, the letter D is a delay and an inverted triangle is storage. Version 2 uses them for the present and the proposed method.
Can I change the number of steps and lanes?
Yes, within the limits of each template. Version 1 holds up to six swimlanes and a long list of steps, and Version 3 is designed for a high-level map of up to eight steps.
Does the template work in Google Sheets?
The files are made for Microsoft Excel and use standard formulas with no macros. You can upload them to Google Drive and open them with Google Sheets, but some formatting or charts may look different.
Is my information stored online?
No. The templates are plain Excel files, so the names, addresses, dates and amounts you type stay in your own file on your own computer.
These templates are documentation tools with made-up sample content. Review every SOP with the people who do the work and with your quality, safety and legal teams before you rely on it. Excel is a trademark of Microsoft Corporation; Excel Corner is not affiliated with Microsoft.